close
“First, do no harm.” Interestingly, that line is not part of the Hippocratic oath, although it is attributed to the ancient Greek physician. It’s also not always practical; if we followed it, we would never have surgery, for example. The expression has resonated through the ages because it suggests a balance.
President Trump is trying to rebalance world trade and the interrelated financial system. Since the United States quit the gold standard in 1971, Americans have enjoyed what a former French finance minister described as our privilège exorbitant, in controlling the world’s reserve currency. The U.S. dollar is the most widely held asset by foreign central banks, the most widely used currency for foreign trade, and the currency of choice for many countries to borrow in. When Japan buys oil from Saudi Arabia, it pays in dollars; when Vietnam buys German machinery, it pays in dollars; when Argentina issues bonds on the world market, they are denominated in dollars. Global growth runs on the greenback.
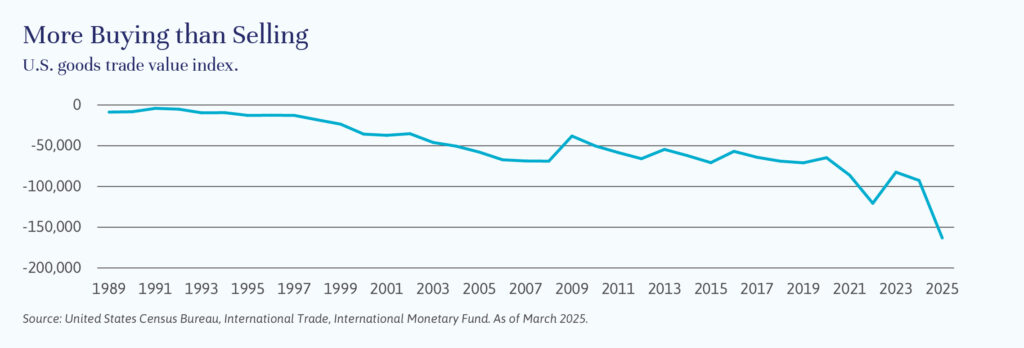
Access to all these dollars is facilitated by a persistent imbalance in the trade of goods between the United States and most of its trading partners. (The United States has a trade surplus in services and has benefited, along with the rest of the world, through the global growth generated by free trade.) But dollars sent overseas do not disappear. Instead, they are invested in U.S. dollar assets, including U.S. government bonds. This support has enabled the U.S. federal government to run ever larger deficits with higher debt levels without stressing the market.
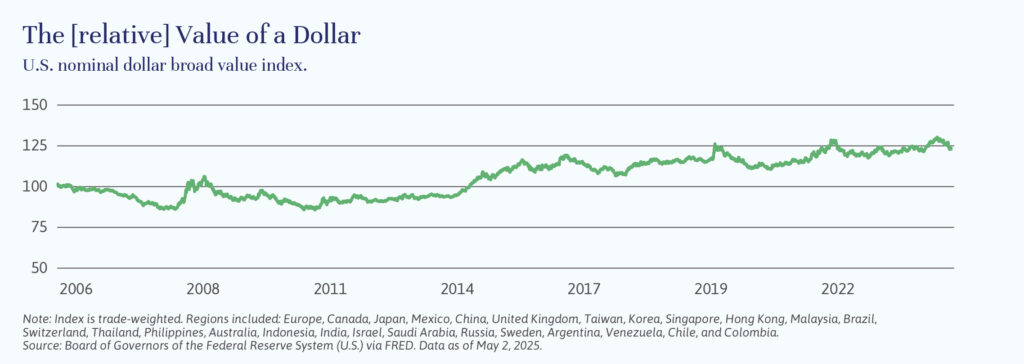
In short, the global demand for dollars, our great privilege, has until recently kept the value of the dollar high. This currency strength has enabled U.S. consumers to buy foreign goods cheaply and enabled emerging markets to build up manufacturing bases to meet that demand, lifting millions of people out of poverty.
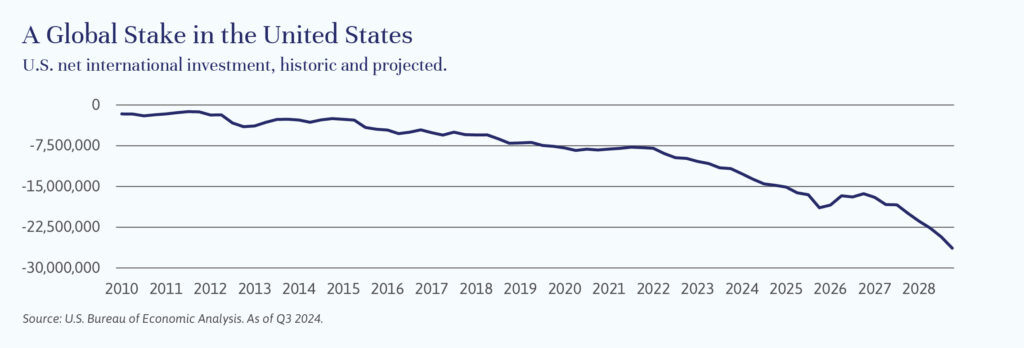
Has it all been too much of a good thing? Clearly, this administration thinks so. As a result of all the additional dollars invested back in U.S. dollar assets – including public equities, government and corporate bonds, real estate and direct investments in plants and equipment – the United States has an increasingly unbalanced investment position. Foreign entities own far more U.S. assets (a net $26 trillion) than U.S. investors own foreign assets. (See the chart “A Global Stake in the United States”.)
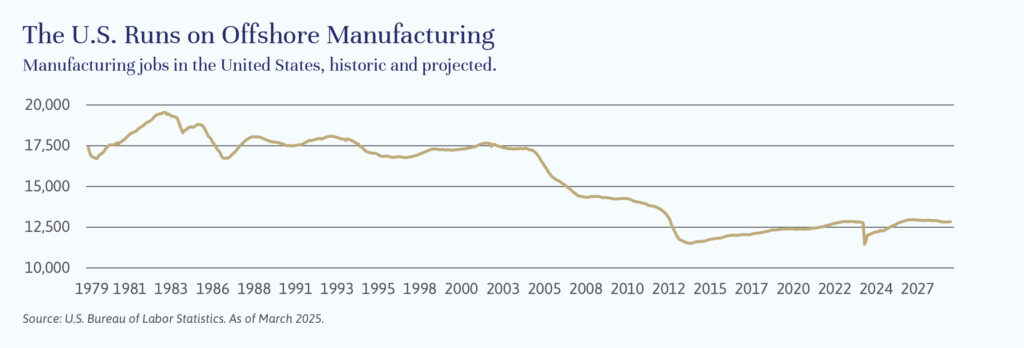
An additional consequence of the current system is that American workers and communities dependent on U.S.-based manufacturing are suffering. And we have become dependent on foreign-made supplies of many strategic items, including manufactured goods and materials necessary to build up and replace armaments and other military equipment. Addressing these issues through onshoring will take considerable effort and time and investment – and will not be economically advantageous in many cases.
A managed devaluation of the dollar has been tried in the past. (See the article by Brian Pollak “A Brief History of Reserve Currencies”.) The efforts this time so far are more like a shock treatment. Very high and erratic tariffs and related threats are making the patient worse. The U.S. dollar is falling now, but possibly for the wrong reasons. After a dizzying spate of contradictory announcements from President Trump, the world is questioning the basic assumptions that have underpinned its reserve currency status – the economic vitality and political stability of the United States, along with our commitment to the rule of law, defense guarantees, and our responsible, independent central bank.
While we continue to expect that the extreme tariff rates will be reduced, partly in response to market reaction, and that the dollar will decline more gradually, there is now an increased probability that the United States and much of the world will enter a recession.
We are managing portfolios with these heightened risks in mind. In uncertain times, it is imperative that portfolios are well diversified. Our clients have benefited from being overweight U.S. public equity – and those gains are now being rebalanced in favor of international equities, as well as private equity where appropriate (see the article by Stephanie Hackett on “Buying, Building and Selling: Investing in Private Equity”) and public and private credit. These asset classes provide further diversification and, in the case of credit, enhanced income. Additionally, there should be sufficient cash and short-term bonds in portfolios to fund spending needs for two years or more.
John Apruzzese is the Chief Investment Officer of Evercore Wealth Management. He can be contacted at apruzzese@evercore.com.
Companies backed by private equity in the United States now outnumber publicly traded companies by two-and-a-half times, a 400% increase since 2000.1 They represent the fastest-growing sectors of the market, generating many technologies, products and services that investors cannot access in the public markets. What’s more, private companies have outperformed publicly traded companies in 97 of the last 100 quarters, on a 10-year rolling return basis.2
For many qualified investors, private equity is now the most exciting asset class.
The concept hasn’t changed much in 25 years. Private equity firms raise capital from outside investors and use it to buy companies with the goal of increasing their value and, eventually, realizing a profit. This process often involves expansion or restructuring, improving operations, strengthening management, and supporting companies through periods of stress.
What has changed is the scale of the investment set. Options range from very early-stage companies developing new products or technologies, to investing now in established businesses that need capital for expansion or operational improvements. Of the U.S. companies with annual revenues over $100 million, 86% are still private.3 Not surprisingly, they are in no rush to list. As private capital ecosystems continue to grow and strengthen, these companies can stay private for longer.
Two areas of private equity appear particularly attractive at present. The first – buyouts – are investments in established businesses with stable cash flows to implement operational improvements, expand to new products or geographies, eliminate unnecessary processes or costs, or to make add-on acquisitions. Buyouts acquire controlling and/or majority stakes and typically use larger amounts of debts. The second – growth equity – is made up of companies with proven business models that experience high growth rates or pivotal change, along with some recurring revenues. Growth equity investments are typically minority ownership stakes using little or no debt.
Private equity buyout managers have adjusted to higher interest rates and the higher cost of capital by reducing the amount of leverage. The market corrections over the last few years have forced companies to balance between growth and profitability, making this a compelling time to invest new capital.
Growth equity valuations have fallen by more than half from their 2021 peak, as initially overly eager investors came to realize that valuations should always reflect the illiquidity and complexity inherent in this asset class. Transaction volume has decreased, and private equity funds have struggled to attract new capital funding over the past two years.4
But the survivors have continued to build their customer base and grow revenues. The technology sector has been buoyed by strong fundamentals, and deal activity in tech started to uptick in 2024 and is expected to continue to increase in 2025-2026.5 The private equity healthcare sector has lagged over the past several years due to regulatory complexity and policy uncertainty but is also gathering steam.6
At Evercore Wealth Management, we are focused on manager selection in this asset class and advising clients on their optimal allocations. For those investors that have a long-term investment horizon and a risk tolerance for illiquidity, allocating to private equity can add diversification and potential for outsized growth. Private equity and other illiquid investments generally represent between 5% to 20% of individual portfolios, depending on investor qualification, investment horizon and goals.
Stephanie Hackett is a Partner and Portfolio Manager at Evercore Wealth Management. She can be contacted at stephanie.hackett@evercore.com.
Choosing the right managers is key to success in private equity, as we expect our private equity investments to earn a premium that will compensate for illiquidity.
Private equity remains an inefficient asset class, meaning that information access and manager skill can be significant drivers of return. It is critical to identify managers able to buy well, build well and sell well:
Buy well: Private equity funds have historically bought companies at valuation multiples that average 2.5 times lower than public market multiples.7
Build well: Private equity funds have been able to build companies with higher and more resilient growth through economic cycles, despite higher leverage.8
Sell well: Private equity funds add value during their ownership, selling better businesses than they bought. The average valuation multiple for private equity-backed companies is 1.2 times higher at exit versus what the managers paid at entry.9
Over the past 10 years, the dispersion in performance between the top quartile and bottom quartile for public equity portfolio managers has been between 2% to 3%. In private equity, this performance differential is 20%-plus.10 And there is greater evidence of performance persistence in private equity. About 70% of private equity funds that performed in the top quartile of their vintage year have a successor fund that also generated above median returns.11 Top-performing private equity funds can attract and retain talent, as well as access unique and proprietary deal flow. They are also able to raise larger successor funds that are often oversubscribed, so the teams spend less time fundraising and more time focusing on their portfolio companies.
— SH
Lawyers now spend seconds on contract reviews that used to take hundreds of (billable) hours. Data center cooling costs are being slashed. And digital agents are helping customers unlock productivity at an exponential scale. These are just three examples of Artificial Intelligence, or AI, driving meaningful change in corporate America. Potential further advances – in medicine, robotics, vehicles, marketing, you name it – suggest that the surface has barely been scratched.
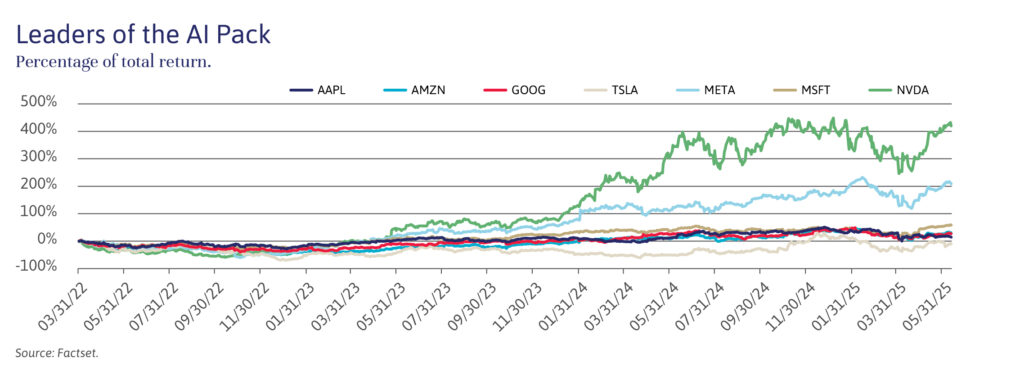
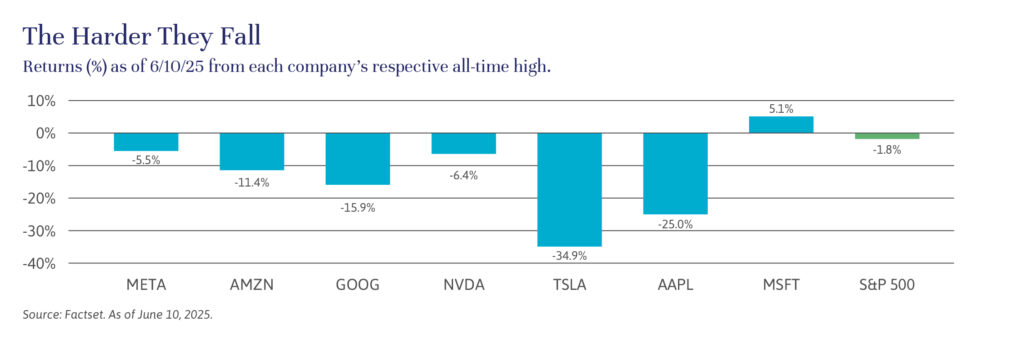
Still, AI has tested investors’ patience lately. After years of dramatic market outperformance, the share price of most members of the so-called Magnificent Seven – Amazon, Alphabet, Apple, Microsoft, Nvidia, Meta and Tesla – tumbled in recent months, as illustrated by the chart below. Though several have recovered appreciably, investors are clearly looking for a payoff.
It’s still early, though. Microsoft CEO Satya Nadella recently noted the evolving deployment of AI and the cloud, pointing out that most companies are early in the process of moving from the AI training phase of adding data and teaching models to understand specific data and processes, to the “inference” phase, in which AI models are deployed to actively drive results. Think of it as moving from learning how to ride a bike to actually riding it.
The gains we’re seeing today may be relatively simple compared to what’s coming. Nvidia CEO Jensen Huang and others have been focused on the next wave of AI: agentic AI, robotics, and autonomous vehicles. Agentic AI refers to systems that can make decisions and act autonomously to complete tasks. A customer service agent that automatically replies to emails, processes returns and updates records without human intervention would be an example. In robotics, companies like Boston Dynamics use AI to help machines navigate terrain, recognize objects, and perform complex functions like warehouse automation. In the world of autonomous vehicles, Tesla and Waymo use AI for real-time decision-making, enabling cars to detect obstacles, follow traffic rules, and operate without human drivers.
At a recent investor conference, Uber CEO Dara Khosrowshahi said that he was seeing a shift from “little optimizations that increase some efficiency by five percent [to] 20%, 30%, 40% increases in efficiency.”1 As these use cases scale, powered by Nvidia chips housed in hyperscaler data centers owned by Amazon, Microsoft and Google, the broader payoff grows more tangible.
Crucially, the pace of innovation is accelerating. Each breakthrough builds on the last, compounding gains and shortening the time between invention and implementation. AI adoption has quickly risen to the top of the corporate priority list, with many seeing it as essential to staying competitive, agile, and efficient in an increasingly digital world. Success will be measured by improvements in margins and operational output. For hyperscalers, it will come down to revenue growth and free cash flow. Microsoft, for one, is seeing stronger-than-expected AI revenue growth in its Azure cloud division, but time will tell if the revenues come to justify the scale of its investment.
There will be bumps along the way. A slowing economy is causing CIOs to tighten budgets. Trade tensions are complicating supply chains and investment strategies. Regulatory issues will take years to settle. Even as open-source breakthroughs like DeepSeek challenge AI incumbents, they also reinforce the sector’s immense potential and, by extension, the long-term value of cloud infrastructure and leading-edge hardware.
In the end, the promise of revolutionizing business operations is simply too great for most companies to ignore. At Evercore Wealth Management, our portfolios include both companies providing AI technology and beneficiaries. For patient investors in companies positioned to take advantage of the AI revolution, we believe that the potential for gains should be well worth the wait.
Michael Kirkbride is a Partner and Portfolio Manager at Evercore Wealth Management. He can be contacted at michael.kirkbride@evercore.com.
Gold could be considered the first reserve currency. The first gold coins that we know of were struck around 550 BC, initiating a measure of value and facilitating trade and transactions between different groups of people – even those from different regions and cultures – that has lasted to this day. Gold remains a monetary asset to this day, never entirely losing its luster.
Spanish silver dollars, also known as Spanish Pieces of Eight, and Dutch guilders are now collector items. But each also had their time in the sun. Pieces of Eight emerged in the 16th century as the first reserve currency associated with a sovereign nation. The coins were uniform in weight and silver content, making them a reliable medium of exchange as Spanish ships traveled around the world. The Bank of Amsterdam, established in 1609 and often considered the precursor to modern central banks, was the first public bank to offer accounts that were not directly convertible to coin, creating a new and easier form of transferability and liquidity. This innovation supported the use of the Dutch guilder as a global currency, as did the simultaneous rise of the Dutch East India and Dutch West India trading companies, which expanded global trade throughout Asia and the Americas.
By the 19th century, trade and capital investments were often denominated in sterling. Britain’s dominance in technology, innovation and production allowed its goods to be sold around the world and created the need for large quantities of raw materials and natural resources. Sterling weakened substantially through the world wars, when Britain took on significant debt and exhausted its foreign reserves. Nevertheless, it maintained an important position in global trade and as a reserve currency for much of the world until the end of World War II, when the sun finally set on the British empire.
Enter the U.S. dollar. The U.S. manufacturing base, unscathed by the Great War, became a producer of goods for all of Europe, including the United Kingdom, helping to elevate the dollar to a global currency. In addition, the U.S. dollar generally remained a hard-backed currency during this period, while many European currencies of the day, including sterling, did not. (The United Kingdom went off the gold standard from 1914 to 1925 and then permanently in 1931.) U.S. dollars poured into Europe and Japan after World War II to rebuild and redevelop shattered economies and infrastructures.
The Bretton Woods conference of 1944 codified the role of the U.S. dollar as the foundation of the global financial system. Here, most global currencies were officially pegged to the dollar, which was pegged to gold at a fixed exchange of $35 an ounce. The World Bank and the International Monetary Fund were established as well, all with a goal of stabilizing the post-war global economy.
It was, without a doubt, the American century. But there were two significant currency events since Bretton Woods, both provoked by large global trade imbalances.
The first was the so-called Nixon Shock of August 1971, in which the United States broke the Bretton Woods agreement by ending the convertibility of dollars to gold. The country was then running significant (although small by today’s standards) twin trade and fiscal deficits. Americans were buying a lot of West German and Japanese goods (the trade deficit) while funding the Vietnam War and the Great Society programs (the fiscal deficit). At the same time, many central banks were converting their dollars into gold, draining U.S. gold reserves, while the United States kept printing dollars without enough gold reserves to back those dollars.
Leaving the gold standard solved the problems of the day, weakening the dollar and rebalancing trade, at least for a time. It also gave global central banks, including the U.S. Federal Reserve, more autonomy over monetary policy, allowing most global currencies to float freely. But it made the dollar a fiat currency, wherein the value of a currency is derived from trust, not by the backing of a physical metal. This has caused the devaluations of less powerful currencies, such as the Argentinian peso, and many more currency crises. Some economists believe that those monetary policy actions were at least part of the reason for the stagflation (slow growth and high inflation) that persisted in the United States through much of the 1970s.
The second major intervention was the Plaza Accord of September 1985. In the years prior, the dollar had appreciated significantly against other major currencies, largely due to the relatively high interest rates implemented by Federal Reserve Chair Paul Volker to fight inflation. The recovered strength of the dollar had made U.S. goods more expensive to export and foreign goods cheaper to import, leading to another large trade deficit, again with West Germany and Japan. The Plaza Accord participants (the G5 – the United States, the United Kingdom, Japan, West Germany and France) agreed to work toward weakening the U.S. dollar, specifically in relation to the Japanese yen and German deutsche mark. The Accord essentially worked, leading to a lower dollar and a narrowing of trade imbalances. By 1987, the Louvre Accord was struck, essentially reversing the Plaza Accord, ending the period of dollar weakness and stabilizing the global currency markets.
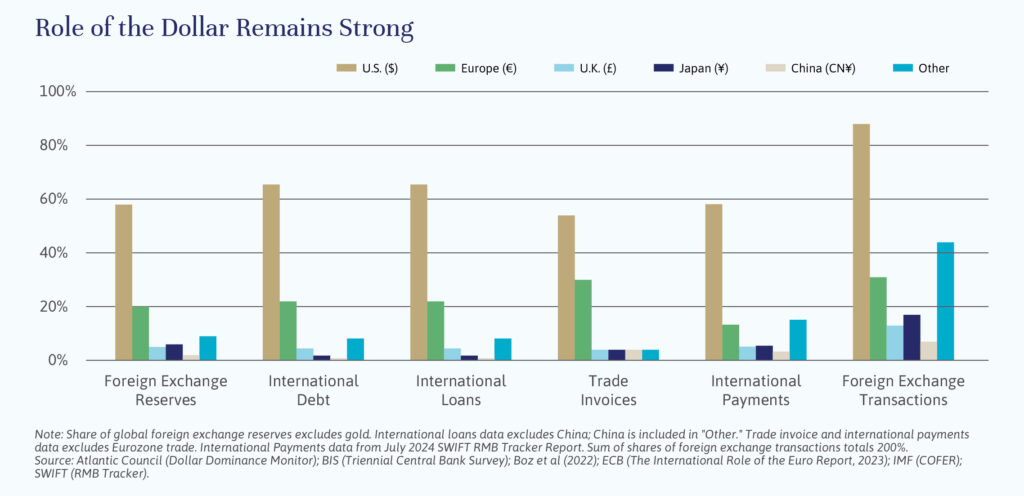
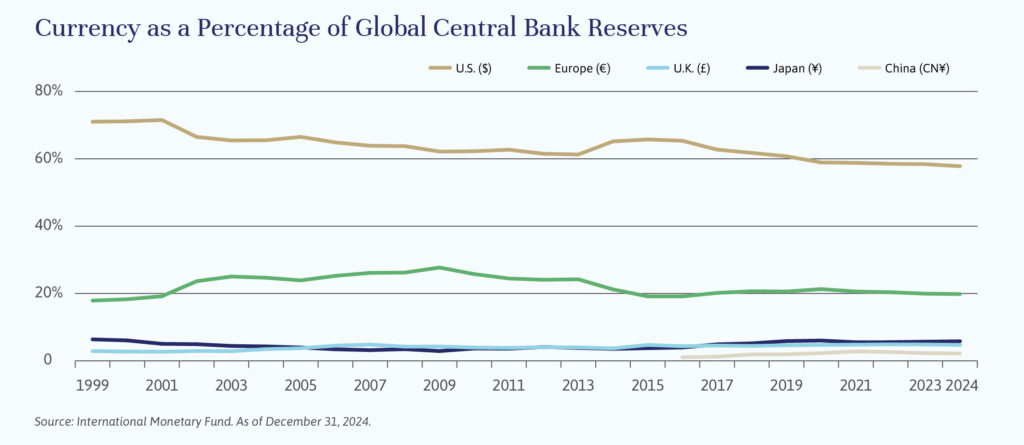
Will the Trump administration’s attempts to weaken the dollar constitute another major dollar intervention? It’s too early to say. The fiscal and trade imbalances of today are more significant than those of either 1971 or 1985, but the economy itself is in better shape, and the dollar continues to benefit from global trust in the United States, as illustrated in the chart “Role of the Dollar Remains Strong”. Still, there are already signs that the dollar is fraying. Its share of global central bank reserves fell 13% over the past 25 years as others grew, primarily the Euro but also the yen, sterling, and the Chinese yuan. (See the chart “Currency as a Percentage of Global Central Bank Reserves”.) And gold, the original reserve currency, still plays an important role 2,500 years on. International debt, currency denominations, international trade and foreign exchange transactions tell a similar story.
It is reasonable to predict that the dollar continues to erode, ceding more of its dominance as the global currency. The difference this time is that there is no single alternative currency waiting in the wings, at least not yet. The Euro suffers from still uncoordinated fiscal policies; the yuan is still a highly managed currency, currently kept deliberately low by the Chinese government; and the yen suffers from demographic challenges and very low interest rates. Digital assets like Bitcoin are nascent and highly volatile. Stablecoins are a more likely potential solution, but digital assets pegged to one or more fiat currencies remain in a very early stage of development. And gold, while shining bright at present, is not a scalable alternative. For most U.S.-domiciled investors, who will want to match dollar liabilities with dollar assets, diversification away from the dollar makes sense only incrementally.
Brian Pollak is the Head of the Investment Policy Committee at Evercore Wealth Management. He can be contacted at brian.pollak@evercore.com.
Editor’s note: Asset-backed credit is an important and growing asset class. Here we interview Michael Paniwozik, president of Apollo Asset Backed Credit Company, or ABC, one of the carefully selected outside fund managers that supplement the core capabilities of Evercore Wealth Management. Please note that the views of the external managers interviewed in Independent Thinking are their own and not necessarily those of Evercore Wealth Management.
Q: Let’s start at the beginning. What is asset-backed finance, exactly?
A: Asset-backed finance is a critical tool for financing the day-to-day activities of millions of businesses and consumers globally. It encompasses a broad set of credit types that touch everyday life, from residential mortgages, credit cards and student loans, to planes, trains, automobiles, sports and entertainment royalties, and more.
This asset class can provide investors with downside protection through credit enhancement and structural safeguards, as well as diversification and yield at the investment and portfolio levels.
Q: How does Apollo approach asset-backed finance?
A: ABC affords investors access to high-quality asset-backed instruments across a diverse range of sectors, providing yield in excess of publicly traded credit of comparable quality.
Our proprietary sourcing engine – along with disciplined “purchase price matters” investment philosophy and the scale and diversity of our capital base – allows for access to a differentiated risk/return profile within private credit. The breadth of our offering across all different types of asset-backed risk enables us to invest in all market conditions.
Q: Why is that important?
A: Our asset-backed investments offer access to diversified collateral pools across unique and idiosyncratic asset classes. This differentiation makes asset-backed finance particularly impactful, as its performance is generally less correlated to corporate credit, delivering attractive diversification and enhancing portfolio resilience.
Unlike allocations to direct lending, which from a risk standpoint compares to single-B/high-yield risk, private asset-backed credit is predominantly investment grade or investment grade-like. About 80% of the portfolio is investment-grade or IG-equivalent, with de minimis subprime exposure. Our investors use ABC as a replacement for or complement to public fixed income exposures. Zero portfolio-level leverage further enhances downside protection and reduces forced selling risk.
Q: What is your impression of the scale of this opportunity?
A: The asset-backed finance, or ABF, market is massive, with around $20 trillion in market size globally. This makes it much larger than the circa $3 trillion public/private leveraged corporate credit markets. It is experiencing the same type of de-banking that we have seen with corporate finance, creating opportunities for non-bank financial institutions like Apollo to access the underlying assets and structure private ABF loans. Private ABF loans can offer 1% to 2% premium in spread/yield versus both public ABF and public corporate credit on a ratings- and duration-matched basis.
Q: Why do you believe the ABC is particularly well placed to take advantage of this opportunity?
A: ABC is a semi-liquid, turnkey solution that provides investors access to high-quality, asset-backed instruments across a diverse range of sectors, aiming to provide yield in excess of publicly traded credit of comparable quality. We seek to invest in what we believe will be the most attractive risk/return opportunities across the five major categories of the asset class, focusing primarily on directly originated investment grade or equivalent assets.
And of course, ABC benefits from the Apollo ABF Platform’s broad origination channels. The firm has been investing in asset-backed credit for over 16 years and now has more than $312 billion deployed. We have 30-plus direct sourcing platforms and partnerships with 4,000 employees working on various asset-backed risks every day. We originate approximately $75 billion annually in asset-backed finance across some 50 asset classes and have material skin in the game with strong alignment with our investors.
Q: What is your outlook now?
A: We believe private markets remain an attractive alternative due to their resiliency, lower volatility and lower correlation to public markets. Public markets tend to experience extreme price movements when liquidity evaporates. Private markets are priced upon the fundamentals and financials, mitigating the lack of liquidity and discounts.
It’s also worth noting that ABC’s holdings are backed by thousands of underlying borrowers across sectors and geographies, reducing idiosyncratic risk. With broad exposure across five asset-backed pillars, ABC avoids overconcentration and has minimal direct sensitivity to tariff-impacted sectors.
For further information, please contact Evercore Wealth Management Partner and Portfolio Manager Stephanie Hackett at stephanie.hackett@evercore.com.
Oscar Sloterbeck
Editor’s note: Oscar Sloterbeck is Head of Company Surveys at Evercore ISI, one of the sources of research considered by Evercore Wealth Management. The surveys are used by ISI macro and fundamental research teams to measure the evolving strengths and weaknesses of the U.S. economy. Executives, typically CFOs and Treasurers, at 325 companies across 29 industries provide an index rating based on their evaluation of the strength or weakness of recent sales adjusted for the time of year.
Company capital expenditure, or CapEx, on technology is rising again, albeit at a moderate pace, according to our 2025 CapEx & Hiring Plans Survey, conducted after the U.S. presidential election.1 This outlook is consistent with solid U.S. economic growth.
Following the pandemic-driven decline in 2020, nominal CapEx growth was strong in 2022 and 2023, before moderating in 2024. Structural investment in data centers, industrial, tech, infrastructure, and pharmaceutical facilities has been strong, as has the upgrade of existing plant and equipment, as companies focus on boosting domestic production and increasing productivity. Spending remains high in these areas, but growth is moderating. We continue to see most U.S. multinationals increasing the U.S. share of their global CapEx budget as companies work to derisk their supply chains.
One variable that could change 2025 CapEx plans is a cut to the U.S. corporate tax rate. Companies are telling us that reinvestment will be the top use of funds if a U.S. corporate tax rate reduction occurs in 2025.
While overall CapEx is expected to slow, companies plan to increase tech spending in 2025. The focus of spending includes cybersecurity and AI, as well as CRM and ERP systems. (Editor’s note: Artificial Intelligence, Customer Relationship Management and Enterprise Resource Planning systems, respectively.)
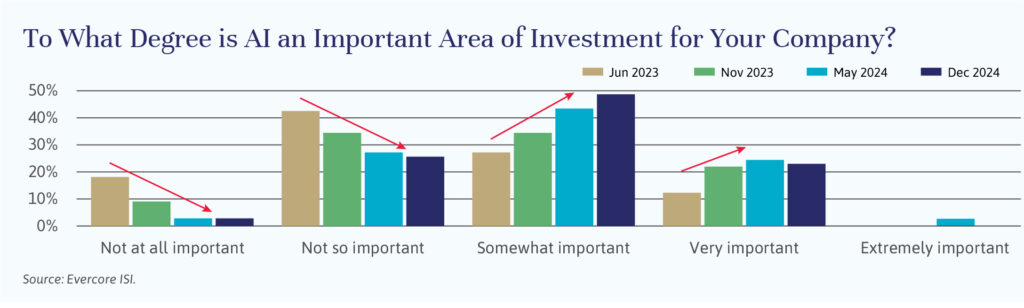
In our 2025 survey, 71% of respondents categorized their AI investment as important, up from 56% in November 2023. Large companies view their AI investment as particularly important relative to companies with less than $1 billion in annual revenues. Firms expect to see the greatest value in their AI investment from internal efficiencies, with additional value deriving from customer service and sales and marketing. Many are focused on the potential impact on labor markets from the increased use of AI. Currently, roughly one-third of companies report that AI is already augmenting their human labor; the majority see any replacement of labor from AI as more than a year away. Recent productivity data has been good, enabling the U.S. economy to sustain solid growth while inflation has moderated. Our survey shows the funds for investing in AI are coming from other areas of spend, and for this year, it appears the funds allocated to AI are coming from traditional areas of CapEx, as opposed to the tech budget.
Companies do have concerns that are limiting the use of AI and are restraining investment. The most common gating factors include accuracy and reliability, followed by cleaning and preparing internal data, as well as cybersecurity and legal concerns.
Turning to labor markets, companies told us that hiring plans for 2025 are ticking up modestly, after decelerating from their all-time high in 2022 when job growth surged out of the pandemic. This improvement is broad across industries from consumer to industrials. Real estate companies are the one area showing softness, as the housing market remains mixed. Labor availability in the United States is improving, but labor is still viewed as somewhat “hard to get,” while availability remains pretty good in Asia and Europe where economic growth has generally lagged. The latest data shows signs of stabilizing nominal growth, and our 2025 CapEx & Hiring Plans Survey suggests the new year will see an increase in tech CapEx and stabilization in employment.


Editor’s note: Emerging markets can afford U.S.-domiciled investors a range of diversification opportunities at relatively low valuations. Here we interview Caroline Cai, CEO and Portfolio Manager at Pzena Investment Management, one of the carefully selected outside fund managers that supplement the core capabilities of Evercore Wealth Management. Please note that the views of the external managers interviewed in Independent Thinking are their own and not necessarily those of Evercore Wealth Management.
Q: Global equity market performance this year has been driven by a relatively few mega-cap U.S. growth companies. This has led to a significant difference in performance between growth and value stocks, particularly in the United States. Has the disparity between growth and value stocks also occurred in emerging markets?
A: The growth cohort is outpacing value in emerging markets as well, albeit by about six percentage points versus over 19 percentage points in the United States. The bulk of growth’s alpha stems from a single company, TSMC, which is NVIDIA’s AI chip supplier. This Taiwanese foundry giant had an approximately 17% average weighting in the MSCI Emerging Markets Growth index in 2024, returning roughly 70%. TSMC is not included in the MSCI Emerging Markets Value Index, but it is included in our portfolios, as we believe the stock remains cheap relative to its intrinsic value.
Q: For U.S.-domiciled investors, what is compelling about investing in emerging markets now?
A: Emerging markets are particularly cheap, in our view, trading at a 48% price-to-forward earnings discount to the top-heavy U.S. equity market. This offers investors diversification at the largest discount in more than two decades.
That said, we believe it’s important for investors to be selective when it comes to emerging markets. They are inherently disparate, with each country possessing its own unique risks and opportunities. Today, we are observing the type of valuation dispersion that is typical of such a diverse asset class, with India and Taiwan, two countries that we’ve reduced exposure to amid surging equity markets, trading at the upper end of the valuation spectrum, while China, Korea, Brazil, and others (all of which we’ve added to) now boast single-digit forward earnings multiples.
Q: If investors want to invest in emerging market countries due to the higher growth rates of these economies, how can a value approach lead to superior returns?
A: Perhaps because developing nations often post higher GDP growth rates than their developed peers, many market practitioners view emerging markets investing as a growth story. However, the value approach has proven far superior over time, with cheap emerging markets stocks (those with low price-to-book ratios) outpacing expensive names by 430 basis points per annum since 1989.1
Higher-beta emerging markets understandably endure more frequent bouts of volatility but can offer amplified return potential for value investors. We believe this is due to four key factors:
Psychology. Investors tend to exaggerate the significance of near-term problems, effectively discounting the potential for business, industry, management, currency or macroeconomic improvements over time. Active value managers can exploit these overly emotional responses, which are more prominent in emerging markets.
Earnings power. Despite the lack of empirical evidence, investors often inextricably link stock markets to economies, associating GDP growth with higher equity returns. When investors pay up for expectations of future growth, their reactions to disappointment can present a fertile hunting ground for disciplined value investors.
Range of outcomes. Different political and legal structures, currencies, and governance practices all add to the complexity of emerging markets investing, offering robust opportunities across a large pool of stocks.
Under-exploitation. Most investment managers tend to favor macroeconomic or quantitative approaches to emerging markets investing, prompting crowded trades and wider market swings that result in exploitable price dislocations.
These factors present opportunities to buy good businesses with low expectations, at attractive valuations. We believe valuation is the single best determinant of long-term returns in any geography.
Q: The fund is now slightly overweight in China. What do you find compelling about China now that you did not before?
A: China has become the largest hunting ground for emerging markets value in recent years. A macroeconomic slowdown and heightened geopolitical tensions have prompted selloffs in many outstanding Chinese franchises, despite these companies displaying solid financial performance. This has resulted in a large subset of Chinese companies offering financial metrics comparable to emerging markets peers at far less demanding valuations.
Despite a host of stimulus measures announced by the Chinese government in recent months, equities remain broadly cheap. Importantly, our investment thesis for the individual Chinese stocks that we own are not predicated on significant monetary or fiscal support from the government. These businesses are, in our view, trading at exceptionally low valuations that already discount persistent and severe economic pain. As Chinese valuations collapsed, we have selectively raised our exposure to stocks that we believe unjustifiably sold off due to temporary geopolitical and macroeconomic headwinds.
Q: How could the election of Donald Trump, who threatens to impose tariffs on Chinese imports, affect the Chinese companies that you own?
A: Tariffs and trade wars are always a threat, and we assess these risks on a company-by-company basis to determine whether – and to what extent – they might impact our estimate of a business’ normal earnings power. Generally speaking, the businesses we invest in have resilient operating models that we think are able to adjust to changing circumstances, including U.S. import tariffs.
Q: Can you please describe the Pzena process in analyzing emerging market companies?
A: Outside of our initial quantitative screen, our investment process exclusively entails deep, fundamental, company-specific research, whereby we seek to invest in good businesses trading at cheap valuations because of temporary pain that the market is interpreting as permanent/structural.
Our preferred valuation metric is price-to-normalized earnings, or P/N, which is a stock’s market value relative to our estimate of what a business should earn, on average, over the course of a full business cycle under normal circumstances. We only invest in companies in the cheapest P/N quintile of their investment universe. The discount rates we use to generate our normal earnings estimates and compare valuations across emerging market countries vary, depending on the country risk premiums. We use the market’s collective judgment, as proxied by a country’s long-term sovereign rate over the U.S. treasury yield, to measure a country’s risk premium. For example, a Chinese-domiciled company would utilize a materially higher discount rate in our valuation model than a South Korean company, and a South Korean company would have a modestly higher discount rate compared to a U.S. company.
Beyond the impact a higher discount rate has on the valuation of an emerging markets stock, which effectively raises the investment threshold, our research process is standardized across our strategies. Our analysts must understand and consider any factor that affects a company’s business, including the industry/country in which it operates and governance or regulatory issues that can widen the range of outcomes for a company.
For further information, please contact Evercore Wealth Management Partner and Portfolio Manager Judy Moses at moses@evercore.com.
If the history of antitrust law teaches us anything, it’s that innovation is the natural state, at least in the United States. By the time regulators focus on an issue, the market is often already working toward solving the problem.

When the U.S. government first filed its lawsuit in 1906, Standard Oil controlled over 90% of the domestic oil refining market. It also had a major position in pipeline distribution and was building scale in exploration and production. The company’s founder, John D. Rockefeller, was known for using aggressive corporate tactics, including securing exclusive agreements with railroads, driving competitors out of business through underpricing, and acquiring rival firms.
Yet, new competitors and new major oil finds were already on the horizon. The 1901 discovery of the Spindletop reserve in Texas – the first in the state – resulted in the formation of Gulf Oil and Texaco. The merger of Royal Dutch and Shell Transport and Trading Company was completed in 1907, creating the first scaled competitor to Standard. At the same time, the Anglo-Persian Oil Company was growing rapidly in the Middle East, changing the global playing field. It took until 1911 for the final judgment in the lawsuit to break up Standard Oil into 34 smaller companies.
Economically, the breakup created a windfall for Standard Oil shareholders but provided little relief for consumers. Rockefeller, who had stakes in all the new companies, saw his net worth treble between 1911 and 1913 to $900 million, or the equivalent of 3% of U.S. GDP, making him by this measure the richest man in the world1 – a record that has yet to be bested (Elon Musk is currently worth about 1.5% of U.S. 2023 GDP).2 Market dynamics and technology continued to change in ways that would have been unrecognizable to the Standard founder or the government regulators of his time, with new drilling technology, new modes of energy transportation and distribution, and expanding uses for energy all upending the status quo. Today, most of the legacy Standard companies are part of either Chevron or ExxonMobil; pieces of it are now owned by far-flung companies including ConocoPhillips, BP, and Shell.
AT&T, the successor company to Alexander Graham Bell’s Bell Telephone Co., was founded in 1885, and for over a century it maintained a dominant monopoly in both local and long-distance telephone service, and in telecom equipment manufacturing. The AT&T subsidiary Bell Labs was among the most innovative and influential research facilities in the world. The government’s antitrust case took eight years to conclude and another two to result in the breakup and sale of the local telephone business into seven new regionally focused entities, known at the time as the Baby Bells. The long-distance business remained with the legacy company.
A reasonable argument can be made that the breakup allowed for more competition in the short term, which begat more robust innovation, benefiting both consumers as well as investors. But we now know that the technology the government saw fit to break up was soon to be made irrelevant, as fiber optics, cellular telephones and the internet all displaced AT&T’s legacy technology. Consumer prices fell dramatically in the 1990s, particularly for long distance. By 2006, the phone companies stopped charging for long distance altogether, mostly due to robust competition from new entrants, like MCI and Sprint. But the price cuts came at the expense of significant added complexity, as consumers had to enter into separate bill pay and service agreements.
The Baby Bells have since reconstituted in the form of a more modern AT&T and Verizon. However, these companies derive most of their revenue from mobile and fiber optics businesses, both nonexistent businesses in 1982.
The Microsoft 1998 antitrust case did not result in a breakup. Although the initial judgment in 2000 ordered the company to devolve into two segments, it was overturned on appeal. Instead, the company agreed in 2001 to a settlement stipulating that Microsoft had to share its application programming interfaces, or APIs, with third-party companies.
Like Standard Oil and AT&T, Microsoft’s dominance in consumer technology was waning. One could argue that this was in part because of the settlement, which provided an easier competitive environment for companies like Alphabet (Google’s parent company), Meta and Amazon to build significant consumer-facing software businesses. And it is worth noting that allowing third-party API development is the model for today’s major consumer and enterprise platforms, including Google and Apple, which have been extremely powerful in spurring innovation in app development (Uber being perhaps the most obvious example). But competition in consumer technology is persistent, and the businesses Microsoft once dominated are a relatively small part of technology profits today.
Microsoft remains among the most valuable companies in the world. For investors in the company, the first decade post settlement, Microsoft’s shares underperformed the S&P 500 Index, as it took both time and effort to recalibrate the company’s focus to new areas. But investors who held on saw their total cumulative return rise 2,184% over the 23 years since the close of the case, close to triple the S&P 500 Index over that time.3 Today, Microsoft is a dominant cloud computing and enterprise solutions company, with consumer-facing businesses representing only a fraction of total revenue.
During the antitrust case against Microsoft, Bill Gates said, “People who feared IBM were wrong. Technology is ever-changing.” He was referring to the failed IBM antitrust case, which was the fourth largest (after the three discussed here) U.S. government antitrust case since 1900, and arguably the most redundant. But Gates’ point is important as we consider the potential antitrust cases against the Magnificent Seven.
While the incumbents might seem unassailable in 2024, it’s worth recalling that as recently as the end of 2012 (which was the first year all of the Magnificent Seven were public companies), Meta, then called Facebook, had a $63 billion market cap, was down 30% from its IPO earlier in the year, and was struggling to convert its revenue model to a mobile environment. Amazon had a $113 billion market cap, but almost no net income or free cash flow, and had yet to break out their cloud services unit, AWS, now its most important and profitable business, into its own reporting segment. And few had heard of NVIDIA, a $9 billion market cap company that was best known for making semiconductors for high-end gamers. No one has thought of IBM as a technology titan in a very long time.
To quote Bob Dylan, there’s nothing so stable as change. We remain vigilant both in questioning the depth and sustainability of the moats and management quality maintained by the largest technology companies. We are also attentive to opportunities to invest in smaller companies with innovative cultures that could be the subject of the next generation’s antitrust suit.
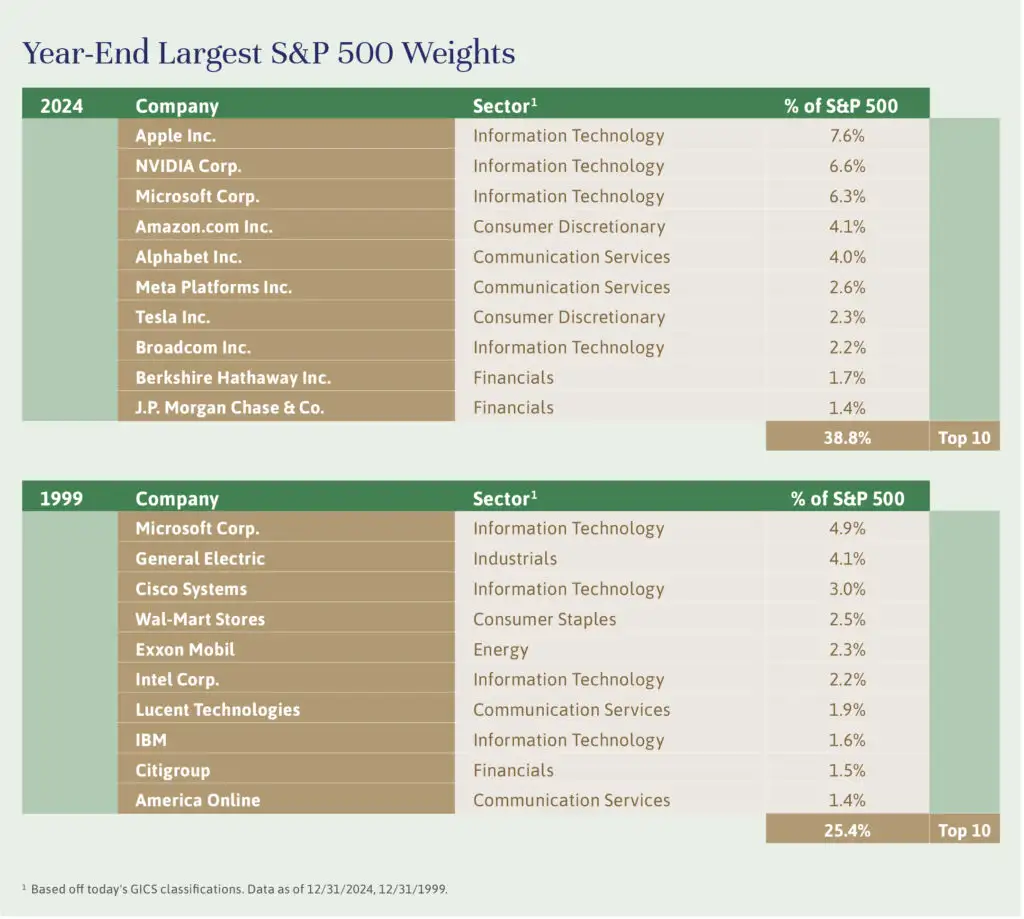
The S&P 500 has become so highly concentrated that it is taking on the higher risk and higher expected return characteristics of an insufficiently diversified portfolio. The largest market cap stocks in the S&P 500, appropriately dubbed the Magnificent Seven, now comprise almost 32% of the index and are growing faster than the remainder.
Prior periods of concentration involved large companies from very different industries, mostly blue-chip companies with strong balance sheets that had grown rapidly in the past but had evolved into risk-averse, conservatively managed companies. Take a look at the chart below, comparing this market with that of 25 years ago. The dominance of the leading companies is greater and less diverse.
The Magnificent Seven companies – Alphabet (Google), Apple, Amazon, Meta (Facebook), Microsoft, NVIDIA and Tesla – are among the most profitable, value-creating business entities ever devised. But they are all digital technology companies that are in large part betting their futures on the emerging AI technology.1 These companies not only have to capitalize on AI to meet current investor expectations, but they must do so soon.
It may take longer than investors currently expect, however. The promise of the internet back in 2000 was eventually realized, but it took years longer than companies and investors expected. Some companies never recovered. Others, like Microsoft, took over a decade to return to their old highs. Digital technology often creates a winner-takes-all dynamic; a global network effect and economies of scale whereby more users drive exponentially more usefulness and value. The main risk to an incumbent is a completely new technological innovation that changes the basic rules of the game. The recent launch of DeepSeek out of China is potentially just such an example.
It is unclear what proportion of these companies’ investment in AI is being spent on beating the other guy, rather than as the result of sober assessments of the potential returns. The Magnificent Seven are also running into the real-world constraint of electrical power capacity. The hyper-scaled data centers that Microsoft, Amazon, Alphabet and Meta are building with NVIDIA computer systems require more power than the current power grid can support, as we will discuss in the next issue of Independent Thinking.
Regulation is another pressing concern. These companies now dominate their respective spaces to the point that they could be considered near monopolies. Meta’s 77% share of social media, Google’s 80+% share of online advertising, and NVIDIA’s control of the latest AI chips are particularly striking.2 They can fend off competitors and earn unusually high margins – for now, that is. In his article, Adapting to Change: The Evolution of the Technology Market, Brian Pollak reviews government efforts to regulate or break up past monopolies and the risks now facing companies that could be considered the same.
It should also be noted that near monopolies are evident in other industries as well. Visa and Mastercard have a near duopoly in payment processing; Walmart, Costco and Home Depot continue to take market share from smaller competitors; and JP Morgan continues to pull away from its smaller rivals.
At the same time, there are at least two important emerging trends that could help smaller companies to grow faster. High interest rates, and day-to-day regulation fall far more heavily on smaller businesses. The Federal Reserve is in the process of lowering interest rates, and the new presidential administration should reduce regulation, even as it takes a closer look at Big Tech. It seems to us that a broadening out of stock market performance would be a healthy development, encouraging emerging innovation and competition.
In the interim, we believe we have positioned our portfolios to continue to benefit from the extraordinary performance of mega-cap stocks and better performance from the rest of the market. We are looking at new technologies earlier and considering the potential implementors. By retaining exposure to most of the Magnificent Seven but underweighting the group, we hope to mitigate concentration risks and to preserve and grow wealth.
Editor’s note: Neo Wang is the lead China economist/strategist at Evercore ISI, the leading U.S. research firm according to Institutional Investor’s annual survey.1 Evercore Wealth Management has limited investments in China, all of which are made through broader emerging market mutual funds.
Beijing is focused on building China into a leading modern socialist country, measured by both composite national strength and international influence, by the 100th anniversary of the People’s Republic of China, or PRC. The founding of the PRC in 1949 ended the century of humiliation, as Beijing puts it. So, what will it take to get there – and what will that mean for investors in the interim?
Economics 101 taught us that output equals labor force times productivity. On one side, China, the major country that is aging the fastest, is experiencing a decades-long secular decline in its labor force. The phaseout of the one-child policy completed in 2015 has hardly helped to revive the birth rate and, in any case, it still takes at least 16 years to raise labor. The idea of raising retirement ages, a seemingly instant solution, has met with strong resistance. Many retired people in China remain productive, helping to care for grandchildren. Any drastic change could send ripples across the economy, risking undesirable consequences.
On the other hand, productivity growth is subject to the law of diminishing marginal return and, in China, the technology “containment and suppression” led by Washington.
The best option left for China to sustain economic growth is to rely more on domestic efforts while striving to maintain business ties with the United States and its allies to realize net technology gains. The Party’s latest catchphrase, “new quality productive forces,” goes far beyond new energy vehicles, lithium batteries and solar panels to include semiconductors, Artificial Intelligence, advanced manufacturing, biomedicine and quantum technology. In essence, it is a supply-side upgrade, to climb the value chain and better serve both domestic and external markets.
Economic restructuring will get a push in this process, which we expect to be reflected in the evolving roles of four growth engines:
First, the supply glut of residential properties means that this sector is unlikely to generate capital gains over the foreseeable future. Any growth in the housing market will likely be solely through urbanization, and at a much slower pace.
Second, infrastructure investment will likely be favored by Beijing over real estate, as it generates a longer-tail economic and/or social benefit. It also helps to ensure a smooth downsizing of capital formation as a share of GDP.
Third, consumption should benefit from both the supply-side upgrade and rising spending power, thanks to the end of enthusiasm for homebuying.
Finally, exports should prove resilient due to China’s increasing supply of goods with higher value-added and at competitive prices to the vast emerging market as its manufacturing sector climbs the value chain.
Separately, so-called Japanification has been a recent rising concern of China watchers. They worry that deteriorating demographics, high debt, and the real estate troubles, all also issues in Japan in the 1990s, may similarly affect investors’ confidence. We think too much attention has been paid to the similar symptoms, while the vast differences have been largely ignored. Editor’s note: We interview WisdomTree Global Chief Investment Officer Jeremy Schwartz on Japanese equities here.
Beijing has been striving to become a reliable supplier and financer serving other developing countries, just as China was served by developed countries over the past four-plus decades. Getting the most out of the growth potential of the entire emerging market should be an indispensable part of Beijing’s efforts to sustain economic growth in the long run. The Belt and Road Initiative was just the start and helped to set the stage.
Soft power is more difficult to achieve. The PRC is an ideology minority and widely regarded by western democracies as an authoritarian regime. The Global South is more likely to embrace Beijing’s leadership and vision, but only to a limited extent given the competing forces, notably from India.
Against this background, we believe that Beijing has no interest in a war across the Taiwan Strait or in the South China Sea. The impressive military buildup is for deterrence so that it doesn’t easily get provoked and cornered into military response. Certainly, observers should question views driven by business or industrial interests, such as arms sales to Taiwan and diversification of chip capacity.
The United States is probably the last country interested in seeing China’s rising international influence. The two countries are engaged in a Cold War and de-risking, aka technology decoupling, will remain the dominant theme of the relationship. But deep economic integration and nuclear weapons greatly reduce the chance of falling into the Thucydides Trap, when a rising power threatens to displace a ruling power and a deadly pattern of structural stress sets in. We expect the two countries to remain adversaries, more contentious than competitors but not quite enemies. Compartmentalization should be the approach to manage the relationship.
As for the European Union, we expect Beijing to stay flexible and pragmatic, with the need to manage U.S.-China relations as a main consideration in its approach to Brussels.
One way China can increase international influence is by taking the lead in global efforts to cut carbon emission. China could potentially benefit greatly from this process, in areas such as industrial upgrades and reducing import dependence. Another way may be by playing a bigger peacemaking role. However, we expect Beijing to remain primarily inward focused and don’t see any reason it would want to help bring to an end any distraction in Washington.
Paramount leader Xi Jinping has been maintaining a tight grip over power and is expected to serve at least a fourth five-year term until 2032 when he will be 79 years old. After that, he will likely maintain his influence by retaining control over the People’s Liberation Army. With the fate of China largely hinging on Xi, two risks exist. One risk is in his health, rumored at times to be poor. We hope there is a succession plan, but there is no heir-apparent. The other risk is in the chance of a major policy error. Xi is a true Communist, like Mao, but there are important differences in their education, experiences and access to external views, which seem to us to mitigate this second risk.
At the moment, we don’t see much finger-pointing at Xi, even with the current economic headwinds. Most Chinese attribute these difficulties to lingering effects of the pandemic, rising geopolitical tensions, and the prolonged housing downturn. There is no imminent risk of social unrest, either from young people struggling to find jobs or high earners facing moderate pay cuts. China will remain a surveillance state, but the public is largely accustomed to it and perceives more benefits than drawbacks, a mindset encouraged by the government-controlled media.
From an equity portfolio investment perspective, we expect China to become increasingly less of a country story and more of a sector or stock play. Xi is playing the long game, attaching significant importance to sectors of strategical benefit to the country. Most of them feature hard technologies, in contrast to consumer-facing internet technologies. Foreign investors’ return seems not even close to the top of his priority list. To keep making money from China, investors may have to align their investments with Xi’s priorities.
However, some of Xi’s favored sectors are not at all suitable for western investors, because of Beijing’s recent focus on national security. We think the two most suitable sectors are healthcare and clean energy, which are supported by the surging elderly population and Beijing’s ambition for a green transition. Chinese companies are mostly safe if foreign investors avoid controlling stakes. And foreign companies had better avoid collecting genetic information on the Chinese people or supplying critical energy infrastructure.
As China climbs the value chain, the local market should become more competitive, due to stronger competition from Chinese peers and the changing mindset of Chinese customers. Foreign companies’ performance in China will be increasingly unrepresentative of how China‘s economy is doing overall.
Concerns over the repatriation of investment or profits seem to us unwarranted. We do not believe Beijing will punish any U.S. company for no other reason than the general tension with Washington.
For further information on Evercore Wealth Management and Evercore ISI research, please contact Brian Pollak at brian.pollak@evercore.com.
Bill Gates has a good line on change: “People,” he says, “often overestimate what will happen in the next two years and underestimate what will happen in 10.” We see evidence of that now, in the rush to exploit Artificial Intelligence (as described in CapEx: Too Much of a Good Thing?) and the related stock market volatility. If the past is any guide, the capital being spent today will eventually pay off – but the going may not be smooth.

CapEx mega-cycles are generally characterized by the invention of a new, disruptive technology that requires the buildout of massive infrastructure. They tend to revolve around major productivity-enhancing innovations, such as new forms of communication, new energy sources or generation methods, or transportation. Cheap and easy credit can pump investment – so can government backing through direct funding or regulatory support. While government support and debt funding can help a new industry get started, too much of both can often create a glut of capital, which leads to malinvestment.
The early automakers, the advent of electrical generation, and more recently, the smartphone, had prolonged growth trajectories. The industries that grew up around those new technologies all experienced consolidation (meaning many of the early companies failed), as well as continued innovation and capital spending. In the end, however, these advances in technology massively enhanced productivity without any significant economic hangover when their growth eventually slowed.
Other technological innovations were punctuated by overzealous capital spending booms followed by devastating financial crashes. Post-crash, industry growth and investment continued, albeit at a more reasonable pace. Steam locomotion was an early, transformative example. Invented in 1797 in England, the first rail lines in the United States were built in 1827 by the Baltimore and Ohio Railroad. The ability to transport goods and people quickly and safely over long distances changed the nature and trajectory of westward expansion in the country and supercharged national economic growth. In 1862, the Pacific Railway Act authorized the construction of the first transcontinental railroad, which ultimately linked California with the rest of the nation. This and the end of the Civil War in 1865 sparked even more growth, fueled by the combination of government support and debts. That ended in 1873 when Jay Cooke & Co., the bank that financed many railroad firms using high levels of debt, went bankrupt in September of that year. A market panic ensued, ending with bankruptcy of around one-quarter of the 364 railroad companies, and by 1876, 14% of the labor force out of work.
Still, railroads continued to expand after the crisis passed to peak in 1916 at over 254,000 miles. The growth of the railroads and continued improvements in track and locomotive technology spurred ever better connectivity and transportation, speeding the overall development and expansion of the country. The best investments were in the companies that benefited from this development, such as Sears, Roebuck & Company and Standard Oil, both of which leveraged railroads to build their companies to national scale.
Fast-forward to the telecom and internet boom of the 1990s and a similar story plays out at a much faster pace. The telecom CapEx cycle really took off in the middle of the decade as a massive new source of demand (the internet) combined with new advances in fiber-optic technology and the passage of the Telecommunications Act of 1996 (which allowed for more competition and new entrants).
This set off a wave of investment. Technology-focused capital spending between 1996 and 2000 increased by 75.6% cumulatively.1 Many of these big spenders were new entrants into telecommunications infrastructure, spurred by deregulation and further encouraged by a massive growth opportunity. While the internet usage and use cases continued to grow for decades, by 2001 it was clear too much capital had been deployed too quickly. Problems were exacerbated by fraud and too much debt: Global Crossing, WorldCom and Enron all went bankrupt due either to fraud or too much debt, or in some cases, both. The subsequent stock market crash resulted in massive declines, over 70% for both the tech-heavy Nasdaq and the S&P 500 Communications Services Sector Index.2 As with the railways, many of the companies that invested in the fiber build-out of the 1990s were not around to see it come to fruition. While AT&T, Verizon and Cisco are all still around, Amazon and Google, which used the internet and telecommunications network to build massive global businesses, turned out to be better investments.
AI is at least as likely to generate new industries and avenues for growth. But how long before today’s investments pay off? Is AI the next smartphone or will the cycle look more like the telecommunications industry? At current spending rates, Herculean growth assumptions must be achieved over relatively short periods. The biggest players know that, however, and they – Amazon, Google, Microsoft and others – have massive balance sheets and are taking on very little debt.
As investors, we are reasonably confident that these companies, among a few others, will be able at present to focus on AI’s potential over the next 10-plus years, and not just the next two, which mitigates the worst-case volatility for this cycle. But we are also cognizant that in past cycles, the best investments were often the beneficiaries of the innovation, not the innovators themselves. Sears was a better investment than Union Pacific in the first decades of the 1900s, just as Amazon was a better investment than Cisco in the first decades of the 2000s. We are focused on finding companies in healthcare, financial services and manufacturing that will be the primary beneficiaries of this CapEx cycle.
Brian Pollak is a Partner and Portfolio Manager at Evercore Wealth Management and the Chair of the Investment Policy Committee. He can be contacted at brian.pollak@evercore.com.
Public and private capital expenditure, or CapEx, is at record highs in the United States. From semiconductor manufacturing to cloud infrastructure expansion, to boosting the energy grid, incorporating Artificial Intelligence, or AI, into our lives isn’t cheap. At the same time, companies are also re/onshoring manufacturing, to control more aspects of critical supply chains and convert to greener energy. As the costs total up, thoughtful investors need to reconcile the benefits and the risks.
The scale of the investment is enormous. The largest cloud service providers – Amazon, Microsoft and Google parent Alphabet – are committed to over $150 billion combined in estimated CapEx spending this year.1 The lion’s share is earmarked for AI adoption, including infrastructure, services and research – to drive ever greater computation at ever greater speeds and scale. As illustrated by the chart below, that’s up almost 50% from collective CapEx spending by these three companies last year, and up over 85% from their five-year average.
In addition to these hyperscalers, next-tier cloud providers such as Oracle and IBM are ramping up their own CapEx to support internal AI programs. Indeed, Oracle is projected to double its CapEx in the year ahead. And Meta and Tesla have similarly massive spending requirements for their own networks, projecting $50 billion and $10 billion in CapEx over the next 12 months, respectively. Next up should be spending by corporations in the broader economy, including in the energy, healthcare, consumer products and financial services sectors, which will require the software, data centers and services that the hyperscalers are building out. In addition, plenty of money will be spent on the delivery of AI to people – the so-called Edge AI, which brings the tools to people’s phones and computers – and the energy necessary to enable all of this.
At the base of this investment is a reliance on access to the semiconductors that power all the data processing and analysis underlying AI. U.S. vulnerabilities here were cast into stark relief by the pandemic and cooling ties with China: The CHIPS and Science Act of 2022 has so far sparked announcements from Micron ($25 billion in Idaho), Taiwan Semiconductor ($65 billion in Arizona), Intel ($96 billion between Arizona, Ohio and Oregon), and Samsung ($45 billion in Texas), among others. All told, 80 or so projects are in the works. It is worth noting that these investments should create significant construction jobs and eventually tens of thousands of high-paying technology jobs, as well as make the United States more self-reliant.
More broadly, onshore manufacturing has fiscal support from the Infrastructure Investment and Jobs Act of 2021 and the Inflation Reduction Act of 2022. But bringing manufacturing back to our shores, which had been moved to China or Mexico over the proceeding decades, will not be a simple or immediate task. Still, 70% of U.S.-based companies with a global footprint have expressed an intent to reshore at least a portion of their manufacturing (per Cornerstone Macro) – and many have indeed begun to do so. This trend is being led by companies involved in manufacturing electrical equipment, appliances and components; computer and electronic products; chemicals; transportation equipment; and medical equipment and supplies.2 CapEx spending here outside technology remains low, but that could change soon.

As for the energy grid, the United States has a deservedly terrible reputation. The demand for capital investment is only more pressing now, as the data centers that power AI are using tremendous amounts of energy. The incremental electricity consumption projected from 2024 to 2030 will be the equivalent of three times that of New York City.3 And re/onshoring manufacturing, as well as increasing electric vehicle usage, will only add to domestic energy consumption. Much of this cost will be borne by government-led initiatives, of course. But the private sector is contributing as well, in the power grid, in transmission and distribution, in pipelines, and on alternative energy sources, including natural gas, nuclear and renewables. Utilities across the country are looking to seize the opportunity to address an uptick in energy demand by targeting high-return investments in expanded capacity. At the same time, supporting the grid is an area of some bipartisan support, with proposed legislation released this past July.4
So, what is the risk of overspending and overbuilding? Will the payback on spending be high enough for the hyperscalers and the other big investors to earn an appropriate return on their considerable capital? In the interim, will the profits generated from AI among the end-users – the smaller companies actually deploying AI in their business practices – meet stock market analysts’ currently high expectations? At this rate, we’ll need to see a major shift in productivity and growth over the next decade or so to justify this spend. And to top it off, high PE multiples and the significant concentration in the S&P 500 index to the hyperscalers leading this investment gives us cause for concern.5
Profits are already showing up at the cloud service providers: Microsoft and IBM have both detailed a direct line to revenues from their massive capital spending, as they have been able to convince many of their customers to spend more on AI-enhanced products. Longer term, this cycle has one big advantage over past debt-fueled CapEx booms. The biggest spenders are the biggest and best capitalized companies in the world, with massive research and customer bases. They are primarily using operating cash flow, not debt, to fund AI-driven spending. They should have time to make sure that their investments pay off.
It is unclear yet whether AI-related productivity enhancements will be worth the cost for the average small- or medium-size company. Call centers, pricing algorithms, supply chain and inventory management, and improved customer interactions are among the many use cases posited, but all need time to be implemented before rates of return on investment become clear. Bigger picture, the prospect of autonomous vehicles, AI-enhanced robotics, new and faster research and development in healthcare, energy, space travel and more could have a massive impact on productivity.
As for dependencies, it’s difficult to argue that a more efficient power grid, a shift to greener energy and, eventually, shorter supply lines aren’t in our broader long-term economic interest anyway. This infrastructure needs to be built, regardless of the AI cycle, and a strong CapEx cycle generally bodes well for the economy. To date within energy infrastructure, we do not see signs of overbuilding or bubble economics. Indeed, the question here is whether the developments in these areas will proceed fast enough to support advances in technology. This is an important consideration as the AI investment cycle unfolds unpredictably in parallel.
We continue to believe that overall portfolio diversification, with exposure to cash, defensive and credit-sensitive fixed income, stocks and illiquid alternative investments, if appropriate, is the best risk mitigator. We are always mindful of having too much exposure to any single trend or investment thesis, regardless of the surrounding hype.
Brian Pollak and Michael Kirkbride are Partners and Portfolio Managers at Evercore Wealth Management. They can be contacted at, respectively, brian.pollak@evercore.com and michael.kirkbride@evercore.com.
Editor’s note: Investors interested in exposure to General Partner-led (“GP-led”) secondaries, as described by Nigel Dawn here, the global head of the Private Capital Advisory Group at Evercore, may be interested in single asset continuation vehicles.
Ricardo Lombardi, Global Head of Strategic Equity at ICG, provided these comments to Independent Thinking. Please note that the views of the external managers interviewed in Independent Thinking are their own and not necessarily those of Evercore Wealth Management.
Q: Let’s start with the basics: What is a single asset continuation investment vehicle?
A: These structures focus on situations in which the GP [the private equity General Partner] wants to keep a specific asset beyond the original investment timeline. As investors, we want to be confident that there is additional upside in the value of the business that can be generated with our capital.
Q: What makes for an attractive candidate?
A: Ideally, the underlying company asset is a market leader in an attractive, noncyclical and consolidating – but still fragmented – industry and is generating organic growth. We look for quality businesses with healthy profit margins and recurring revenues.
Q: Why should investors consider single asset continuation vehicles, as opposed to multi-asset vehicles?
A: In a multi-asset transaction, investors are likely buying assets that range in quality. While that does provide an element of diversification – and most established secondary buyers prefer them for that reason – the quality of single asset deals can be superior, given the right circumstances. After all, the transaction is driven by the sponsor’s interest in retaining a truly outstanding asset. If the buyer has a very disciplined approach to pricing and selection, single assets should have the potential to generate superior risk-adjusted returns.
Q: Any other considerations?
A: The single asset market has significant long-term growth potential because it’s still very small. However, the potential market is underpenetrated and growing – single asset continuation vehicles still represented only 3.8% of total private equity exits in 2023.1 We expect this market to continue growing, as private equity sponsors increasingly appreciate the attraction of the GP-led transactions from the perspective of both liquidity management and portfolio construction.
Q: Please describe your diligence and underwriting process.
A: Our team of direct buyout professionals has the skills to meet with management, visit sites, develop operational models, hire third-party consultants, and evaluate pricing and partnership structures. And we partner with well-regarded and established GPs who are known to us and have already achieved positive results with their asset.
Q: How do you think these GPs see ICG Strategic Equity? What are they looking for in a lead buyer?
A: The GP’s primary interest should be around fairness to its LPs, notably in process and price. Key considerations for the GP should include certainty and speed of execution, as well as stability for themselves and the asset’s management team. We provide a one-stop solution in that we typically commit all of the required capital for the deal, which enables the GP to engage with just one buyer, instead of a syndicate of buyers. That makes the process much simpler and resource-effective.
Q: How are market conditions now? What are you focused on at present?
A: So far in 2024, we are seeing one of the strongest pipelines of deal activity we have ever had, both across North America and western Europe. We continue to see increased adoption by GPs that have never pursued GP-led transactions before, so the addressable market is growing. At the same time, at ICG Strategic Equity we continue to be focused on growing the quantum of capital that can be transacted with a sole buyer, and pursuing continuation vehicle sizes up to $1.5 billion.
With the macro backdrop continuing to drive more GPs to want to create liquidity for flagship funds, plus LPs continuing to want liquidity and increased capital flowing into the market to execute on these deals, we are bullish about the outlook for both the volume and scale of transactions going forward.
For further information, please contact Evercore Wealth Management Partner and Portfolio Manager Stephanie Hackett at stephanie.hackett@evercore.com.
Editor’s note: Nigel Dawn is the global head of the Private Capital Advisory Group at Evercore, leading a global team in originating and executing secondary market transactions for owners and managers of private financial assets (private equity, private infrastructure, and others). Clients include both General Partners, or GPs, and Limited Partners, or LPs, such as financial institutions, university endowments, publicly quoted investment vehicles, and public pensions. Here are some highlights from a recent conversation with Independent Thinking.
Q: Let’s first address your market from the perspective of high net worth investors and related nonprofits, notably foundations and endowments. Why should private investors be interested in the secondary markets?
A: I think the attractiveness of this market is in the potential returns. Effectively, you get to buy private equity at “spot” prices. [Editor’s note: Spot prices are the current liquid market prices of securities.] That’s much better than the primary private equity market where, no matter how good the manager, it’s still 100 cents on the dollar when you are raising a new fund. Also, this is a market where you can deploy your capital relatively quickly and get it back quickly, given you are buying mature assets.
Q: It’s also a market that many investors don’t fully understand, perhaps because it’s changed so much. How do you see the evolution of continuation funds, the strategy that you are known for developing?
A: The secondaries market has pivoted from propping up low-quality GPs with challenged assets to enabling the very best GPs retain their best assets. [Editor’s note: A General Partner is the manager responsible for running a fund.] The appetite to repurpose the continuation fund structure was around for some time, but the pandemic was a catalyst that accelerated widespread adoption.
GPs needed to find a way to ‘buy time’, while providing money back to their investors and while raising new money to support their best companies. We saw that continuation funds could enable them to retain their best companies in all market conditions and offer their investors the choice of selling and receiving cash or continuing to invest in those companies alongside the GP.
It was a huge switch, and then it became a natural evolution, with a strong industrial logic. In the continuation funds transactions, the GPs are well aligned with their investors; they usually start with around a 2% ownership share in their primary fund, but that can potentially rise to between 8% to 10% after the continuation fund has been executed – this is the result of the GP rolling their own gains back into the company.
Q: This shift must be causing some ripples in the marketplace.
A: Good GPs no longer have to sell to another GP and watch them make money in the next phase of growth. It’s a very appealing strategy for them and their investors. Of course, private equity managers who buy a material proportion of their new companies from other private equity managers may see continuation funds as a threat. Continuation funds can potentially generate better risk-adjusted returns for LPs, because the GP is picking the best assets – that’s positive selection bias – and they are putting their own money behind them. There are unlikely to be skeletons in the closet when you “re-buy” a company you already own – which is not something you may know when you buy into a brand-new deal.
I don’t think continuation funds are a long-term threat to the IPO market. It simply means that smaller managers can retain their winning companies until they are big, like a recent client that has a one-billion-dollar fund and a continuation fund with another one billion dollars. They are currently so successful that they don’t see why they should sell.
So, some ripples. But we are seeing positive changes with recent deal flow and institutional LP guidelines, which can act as a template for future continuation funds.
Q: Will we see further layers – continuation funds of continuation funds?
A: We are already seeing some managers wishing to extend the time of their continuation funds. The only constraint on the growth of the GP-driven market is capital. Capital is scarce for GP secondaries in general, and for single-company funds in particular. But we are starting to see a lot of capital formation now. I expect this market to grow significantly over the next three or four years, perhaps fivefold to a 500-billion-dollar global market. The more capital, the better.
Q: So, Nigel, what are you looking for in your clients?
A: Generally, great managers and great assets. They should have already generated good returns, and it should be clear to us that there is additional return to be generated. Usually, it’s an established manager who has held the company for at least two years.
The secondaries market is about diversification, by geography and sector. ICG, for example, has a pet cemetery business, a car wash business, and an SAS business. [Editor’s note: See the interview with ICG here.] But mostly, it’s about the people. Is there a great GP, a great management team? Do they believe in their asset – are they putting real money behind it? Do they have a credible growth story?
Q: There are plenty of Englishmen in New York investment banking circles, but relatively few from the northern industrial city of Sheffield. Clearly, Evercore is a great fit for you; how did you come to be here?
A: After graduating from Newcastle University, I started working at Standard Chartered Bank, in Hong Kong and mainland China, where I met an American woman. That led to a family in New York, an MBA at Columbia, 16 years at UBS, and finally, the move in 2013 to Evercore, where I’ve been fortunate to lead the global growth of this still new and very exciting specialist business. No complaints.
For further information on investing in illiquid alternative assets at Evercore Wealth Management, please contact Partner and Portfolio Manager Stephanie Hackett at stephanie.hackett@evercore.com.
When all the world seems to be going to hell, what should a prudent investor do? Hold tight or buy seems to be the answer, in most situations. For those with a long-term term horizon, equity investments made right before times of geopolitical stress generate returns roughly in line with long-term averages. And those made shortly after the time of the initial shock often realize outsized returns.
That’s not an argument for trying to time the market. That rarely works, as most investors struggle to time both the sale and the repurchase of stocks – and even perfect market timing barely outperforms buying and holding. But it is an argument for staying calm and focusing on long-term goals.
Look at the data. U.S. equity returns since World War I (as measured by the Dow Jones until 1957 and the S&P 500 thereafter) rode out revolutions, terrorist attacks and global pandemics. But not immediately: The initial drawdown averaged 17.5% and nearly 120 days, as illustrated below. But average returns across these events over the subsequent six months, and one, three and five years were all positive (see the chart below). Clearly, longer-term market returns during periods of geopolitical upset are most related to the underlying economic conditions and valuations at the time.

The 1950s and 1960s were generally robust economic times in the United States. Consequently, the markets rose steadily, even after the outset of a hot war in Korea and through the rising Cold War tensions that culminated in the Cuban Missile Crisis, a threat that felt existential to many. The markets were recovering from a decade of high inflation when the Shah of Iran was overthrown in 1979 – and they continued to do so.
Conversely, the markets were still reeling from the dot.com crash ahead of the 2001 attacks on the United States. Consequently, the sharp selloff when U.S. markets reopened on September 17 after a seven-day suspension was only a small part of the story, as the tech-led bear market was at that point only part way toward its bottom – eventually hitting its nadir in October 2002. And during the global COVID-19 pandemic, which generated many geopolitical consequences, investors quickly turned their attention to the tech and productivity boom. The S&P 500 plunged 34% when the outbreak reached the United States, then it rose 65% over the remainder of 2020.
So, what are the exceptions to this market sangfroid? Or rather, what are the conditions that make for exceptions? And are the hot wars waging in Europe and the Middle East, the coming U.S. election, or something else in the works potential candidates for long-term disruption? Events that have changed or can change the trajectory of global economic growth and/or inflation, and therefore corporate earnings, are the ones that can cause long-term damage in the markets. They are few and far between, but the damage is generally considerable. In these cases, investors’ time horizons would have to be long, as the drawdowns lasted a year or more, and market returns for even three and five years were well under expectations. But again, long-term investors were generally better off staying in the market.
The two world wars, to take the most obvious examples, changed the course of trade, production, and the labor force for a large portion of the globe. The U.S. stock market, then best measured by the Dow Jones Industrial Average, took 18 months to recover from the start of the “War to End All Wars”. Twenty-four years later, in 1939, the Dow Jones actually rose 15% over the seven trading days after Germany’s invasion of Poland, as investors bet that U.S. corporations would benefit from selling arms and other goods to the European combatants. Reality had set in by 1940, when Germany overran Belgium and France, signaling that the war would be long, and would include the United States. Interestingly, the market began its rebound just a few months before the Battle of Midway, in June 1942, a sign perhaps that the investors in aggregate this time around were able to intuit the eventual outcome, well before many of the pundits of the day.
Another example of a geopolitical conflict that caused significant economic and market disruption was the 1973 Arab-Israeli War, also known as the Yom Kippur War. The related oil embargo imposed by the Arab Organization of Petroleum Exporting Countries, or OPEC, hit the United States economy where it hurt, and the S&P 500 lost over 40% in the following 12 months. It is important to note that this is unlikely to happen today, at least not in the United States, which is now energy independent and a net exporter of petroleum products.
At present, we have no reason to count either the war in Ukraine or the Middle East, as horrific as they are, among the few events in which the appropriate response would be to sell or to take on the expense of hedging equity portfolios. That’s true too for the coming and remarkably unpopular U.S. election. One potential long-term disrupter that does come to mind is a Chinese invasion of Taiwan, home to most of the world’s high-value semiconductor manufacturing. To us, this seems a possible but not probable event, and one that can best be protected against through appropriate portfolio diversification.
For long-term investors, there have been very few political shocks to which the appropriate response would have been to sell equities. Let’s hope it stays that way.
Brian Pollak is a Partner and Portfolio Manager at Evercore Wealth Management. He can be contacted at brian.pollak@evercore.com.
Is Artificial Intelligence making life better?
It’s certainly not making it any calmer, with AI-generated disinformation stoking two horrific hot wars and threats to democracy around the world. And only 10% of Americans recently surveyed by Pew said that they were more excited about AI than concerned. But investors have a different take.
Mounting evidence that the United States is in the early stages of a productivity boom that may rival the great booms of the past is, in our view, driving the stock market to new highs. And the latest software advances in AI, coupled with an exponential increase in computer power thanks to a new computer architecture designed by Nvidia, are just starting to be implemented.
The dissemination of these new capabilities is happening at a dizzyingly rapid pace as the mega cap tech companies – Amazon, Google, Meta, and Microsoft – are racing to invest billions of dollars in AI computer power and software development, much of it presumably on semiconductor chips made by Nvidia, the biggest winner to date in AI adoption.
The productivity potential of AI is coming at an opportune time. Changing U.S. demographics have created a structural labor shortage and, in turn, a significant need for increased productivity. The benefits at present are largely accruing to the software companies themselves. In just the last quarter, Meta revenues increased by 25% year over year, while pivoting away from its metaverse mistake and reducing staff by roughly the same proportion.
More broadly, software companies are generally forecasting significant productivity gains among software engineers and coders exploiting AI. Nvidia, which enjoys a near-monopoly in the most advanced AI computer systems, has credited the development of H100, its latest systems design, to the aid of AI. Microsoft, Google, Amazon, and Adobe are also early winners in the AI rollout, as they can charge their cloud customers for the AI software that they are embedding in their services. (We own these four companies and Nvidia in our core equity portfolio.)
Longer term, we expect widespread AI adoption to transform U.S. and other countries’ industries, including helping companies fortify their supply chains and wean themselves off imports from China.
Change of this magnitude is never easy, but the timing is fortunate in this regard too. Unemployment remains low in the United States, at 3.8% as of March 2024, mitigating the usual concerns that a powerful new technology will destroy more jobs than it creates. That has been the case, as illustrated in the chart below, but only over the short term. Longer term, technological advances create new, higher paying jobs.
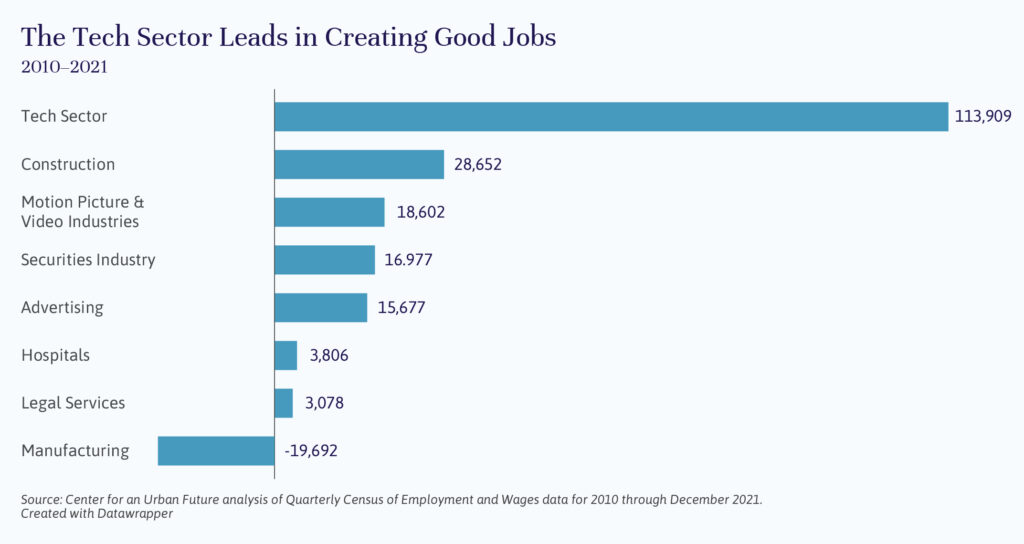
It is difficult to measure productivity trends over short periods of time because of the volatile nature of the two determinants: total economic output and hours worked. Five-year rolling averages, as illustrated by the chart below, are a better indicator of productivity trends.

Real wage growth is an excellent, albeit indirect, way to measure more current productivity trends, as it’s the major positive coincident result of growth in productivity. And, as we can see in the same chart, real wages are improving as the burst of inflation recedes.
In short, we believe there is a better than 50% chance that we are at the beginning of a major productivity boom. This boom could generate 3% or higher annual productivity growth across the economy. If – and this is a big if – the U.S. educational system improves to meet the changing demands of the workplace, the net result in the United States will be an even more robust economy, with even greater economic self-sufficiency and a higher standard of living.
So, life may be getting better. However, it is still early days for long-term investors in AI. We remain mindful that the market can get ahead of itself. (Indeed, many of the companies that were the eventual big winners in the growth of the internet were overvalued during the 90s tech boom.) We intend to have exposure to this exciting area but also to keep our enthusiasm for AI in check and our equity portfolios well diversified.
John Apruzzese is the Chief Investment Officer at Evercore Wealth Management. He can be contacted at apruzzese@evercore.com.
Federal shutdowns may be no way to run a country, but at the state and local level, governments generally make do. At present, municipal bond issuers are in generally good financial shape and should be able to weather the inevitable next shutdown, unless it drags on.
In the wake of the last near shutdown, averted in the eleventh hour on November 14, 2023, by a bipartisan vote to keep the government open until early January, it’s worth reviewing why shutdowns happen in the first place.
Government shutdowns occur when policymakers fail to enact legislation to fund the federal government by the end of the fiscal year, on September 30. Each year, Congress must pass, and the President must sign, legislation to provide funding for most government agencies. That legislation comes in the form of 12 appropriation bills, one for each appropriations committee. Lawmakers may also choose to pass a temporary funding bill, known as a continuing resolution, or CR, to provide funding for a limited time. If lawmakers fail to pass some or all of the appropriations bills on time, and a continuing resolution is not in place, the government shuts down, in part or in full.
The deadline has not been fully met since fiscal year 1997. Instead, lawmakers have come to rely heavily on CRs – temporary, imperfect solutions that avoid the difficult but necessary work of allocating funding. Lawmakers often enact multiple CRs in a single fiscal year before deciding on full-year funding levels. For fiscal years 1998 through 2024, 132 CRs were enacted.
Unlike a breach of the U.S. debt ceiling, for which there is no precedent, there have been 14 shutdowns since 1981, four of which lasted for more than a day, with the longest full shutdown lasting 16 days in 2013. The 35-day shutdown in 2018-2019 was considered a partial shutdown, as Congress had already enacted five of 12 appropriation bills, including funding for the Department of Defense and the Department of Veterans Affairs, which are the largest federal employers.
Programs categorized as mandatory spending, including Social Security, described by John Apruzzese in his article, Watching the U.S. Debt: The Implications for Investors, Medicare, and Medicaid, are not subject to protection, hospital care, air traffic, law enforcement and power grid maintenance workers, along with some legislative and judicial staff, can also be categorized as essential, meaning that they must stay on the job during a shutdown. Federal workers will likely get back pay once a shutdown ends, as they have in previous government shutdowns. However, private contracting companies serving the federal government could be forced to suspend operations and not receive back pay.
While a brief shutdown should not affect state and local budgets, a months-long spending pause could. Should it drag on, government leaders may have to decide if they want to use state funds to replace missing federal dollars and keep certain government services running. While states are in a much better financial position to keep programs going than in the previous extended shutdowns, their rainy-day funds could eventually run dry.
State and localities administer most federally funded social programs for low-income households; that money stops flowing when the government shuts down. In prior shutdowns, states have kept most programs and services running and later been paid back by the federal government. But sometimes they aren’t fully or quickly reimbursed.
Certain states that have federal lands or high concentrations of federal employees will feel the impact of a federal shutdown the most. After the threat of a shutdown in September, the governors of Arizona, Colorado and Utah announced that they will pay to keep national parks open in the event of a shutdown to avoid any loss of tourism spending. Base personnel in military communities are required to work, but they will stop receiving the support they rely on, including a paycheck, childcare, and the already financially challenged USDA Special Supplemental Nutrition Program for Women, Infants and Children.
A shutdown would halt federally required environmental reviews and reviews of grant applications for funding from the Infrastructure Investment and Jobs Act, or IIJA. Rulemaking for the IIJA and the Inflation Reduction Act may also pause. Commercial airports could also be affected, as a shutdown could disrupt the training of new air traffic controllers, who are already in short supply.
While a shutdown could cause problems for some of the most vulnerable members of society that are reliant on federal aid, these programs could be temporarily supplemented by ample state financial resources. An extended shutdown could also delay many capital projects due to the intricate federal approval process that is necessary to proceed.
Overall, we do not anticipate a significant credit problem in state and local bonds. Our clients hold a range of municipal bond enterprise systems in their portfolios. Of these sectors, mass transit has the potential for the greatest disruption due to an extended government shutdown. Mass transit systems, still recovering from declines in ridership during the pandemic and the loss of farebox receipts, are vulnerable to potential losses in federal funds. These exposures are balanced against alternative funding sources in weighing investment allocations.
If Congress continues to threaten funding for well-established federal programs, either through the budget process or through separate legislation, our concern over municipal credit will grow. We will update clients accordingly.
Howard Cure is the National Director of Municipal Bond Research at Evercore Wealth Management. He can be contacted at cure@evercore.com.
If misery loves company, Americans should take comfort in knowing that other countries have similarly high debt burdens. Government debt in the United Kingdom and many European Union member states hovers around the U.S. levels, and Japan’s debt represents more than twice the country’s gross domestic product (GDP). But the real standout is China, because its debt – government, corporate, and household – has grown so fast and is based on such shaky collateral.
China’s debt – including government, corporate, and household borrowing – appears to have doubled in the 15 years since the financial crisis, to around 280% of GDP, as illustrated below. All three components have risen, in contrast to the United States, where corporate and consumer debt have remained relatively stable. And China’s government debt is bigger than it looks, because a large proportion of Chinese debt liabilities are really the responsibility of the government. This debt exists in the form of the approximately $9 trillion of outstanding debt obligations issued by local government financing vehicles, or LGFVs. These shadow debt structures, which are not represented in the government’s debt figures, are backed by land, infrastructure and, ultimately, obligations of local governments. Collectively, they now represent about half of Chinese GDP, bringing the total government debt close to 100%.

It has become clear that many of these projects don’t have the cash flow to support their debt loads. In some cases, they never did. In others, cash flows were predicated on property sales, but when demand for property and, consequently, property prices, dried up, so did the cash flow to pay back the bondholders. Indeed, S&P calculates that it’s possible that up to two-thirds of the real estate sector may be suffering from liquidity stress. Private real estate debt markets have also had significant struggles. China Evergrande, the world’s biggest property developer, and Country Garden, another massive Chinese home builder, have both defaulted and together have in excess of a $500 billion debt load. This has only added to the pressure on the broader property market, and as prices have spiraled downward, the dangers of a highly leveraged, property-focused economy are becoming more apparent.
The central government has stepped in for now, with a plan announced in August 2023 that allows local governments to raise about $140 billion in bond sales to refinance the struggling LGFVs. While this amount will in no way cover all the failing LGFVs, the now more explicit backing of the central government may provide some comfort to investors and banks with exposure to these vehicles. It also makes it clearer that the large debt load represented by the LGFVs can be considered a direct liability of the government.
It’s understandable that China took on this debt. In 1980, about 20% of China’s population lived in cities; today that proportion is about 65%. And there are so many cities now; 160 have populations of over one million people. That enormous transformation required new roads, bridges, railways, airports, power stations, schools, hospitals, and real estate development, both residential and commercial. Unfortunately, the debt incurred to make these investments will be difficult to pay off. Like the United States, China has a large government deficit; the International Monetary Fund puts it at the equivalent of 7.1% of GDP in 2023 and expects it to rise further (see the chart below). At the same time, the population is aging at an alarming rate, as discussed in the previous edition of Independent Thinking. The government will need to increase spending on social services to accommodate the needs of the growing older population. As approximately 70% of household wealth is tied up in the property sector, future wealth creation in the country may be imperiled, and citizens are increasingly likely to be reliant on government entitlements in their retirement.

While we worry in the West about inflation and persistent high interest rates, in China, with inflation flatlining over the last year, deflation and future growth are the pressing concerns, as evidenced by the paltry 2.7% yields on 10-year central government bonds. It is likely that strong sovereign support will contain any issues stemming from LGFVs, at least for the time being. But the combination of high debt, rising deficits, and aging demographics should impinge on China’s long-term growth rate.
At the same time, rising tensions with the United States are suppressing trade and limiting access to some technologies. While forward price to earnings ratios in Chinese stocks are below the long-term historical average and below that of many other global equity markets, they are reflective of a dimming earnings and economic growth outlook. This makes direct investment in China’s stock market less appealing than it’s been at any time since it was admitted to the World Trade Organization in 2001. We are also mindful that China’s economic challenges may reduce the trajectory of global growth and limit the growth of companies and countries with significant reliance on China.
At present, we are limiting exposure to China in our allocations, relative to their benchmarks. We remain open to targeted investments in the country, as the country’s stock market is too big to fully ignore, and there are likely to be pockets of innovation and productivity gains as urbanization continues and the country becomes less reliant on western technology. At present, however, China’s heavy debt burden is an obstacle to growth.
Brian Pollak is a Partner and Portfolio Manager at Evercore Wealth Management. He can be contacted at brian.pollak@evercore.com.
“A national debt, if it is not excessive, will be to us a national blessing,” said Alexander Hamilton in 1781. What might he have made of our $26 trillion debt? At the current clip, U.S. federal debt held by the public will soon exceed nominal GDP, as illustrated below. Without a radical change in the federal budget, we risk entering a terminal fiscal crisis, in which the rising average interest on the debt causes the debt to grow faster than nominal GDP.

Recession, still a possibility, would make matters worse, forcing nominal GDP down while likely driving the federal deficit higher. Like Greece over the last 10 years, the U.S. federal government would eventually be forced into austerity.
There are reasons to think that Congress may act before it’s too late. First, some politicians took note back in June when the bond vigilantes “saddled up,” as Ed Yardeni, the economist who coined the term back in the 1980s, recently put it. The idea is that the vigilantes, concerned about profligate fiscal policy, drive bond yields high enough to create a debt crisis and a recession. Rising yields exacerbate the debt problem, of course, but may also force Congress to tackle it. Efforts to create a bipartisan commission to address the deficit and debt are still in the works, but it’s a start.
Second, the alternative to acting is too grim for just about any politician to bear. When the Social Security program was founded in 1940, U.S. life expectancy was 60.5 years for men and 68.2 years for women. Every year for 39 years, the Social Security Trust funds took in more from payroll taxes than they paid out in benefits, contributing the surplus to the Treasury’s consolidated budget, in exchange for what is essentially an IOU. Today, with over 76 million Baby Boomers in or approaching retirement, and life expectancy at 73.5 years and 79.3 years, respectively, Social Security is in trouble, running an ever-increasing annual deficit that should exhaust its $2 trillion reserve within 10 years. But slashing Social Security benefits by the 25% to 30% it would take to match the program’s revenues is something no politician wants. Lawmakers will have to act, and soon.
So, what would radical change look like? It seems likely that Congress will follow the playbook established in 2013 when it bolstered the Medicare trust fund through the elimination of the wage cap and the application of a 3.8% payroll tax on all unearned income above $250,000. An equivalent remedy for Social Security would be to eliminate the current $160,000 cap on wages ($166,600 in 2024) and apply some or all of the 12.4% Social Security payroll tax to unearned income.
Currently the highest marginal federal income tax rate on unearned income is 40.8% (37% plus the Medicare tax of 3.8%), and the highest marginal federal tax rate on long-term capital gains is 23.8%, which also includes the 3.8% Medicare tax. Benefits could be reduced by a further increase in the retirement age and/or means testing. In any case, at this juncture, all long-term financial planning should consider the very real possibility of higher tax rates on unearned income and capital gains. We do not yet know how high the tax rates could go, but the prospect does potentially reduce the attractiveness of income deferral tactics. (See an extract of our annual year-end wealth planning guide here.)
Clearly, much is riding on how long the Federal Reserve must keep short-term interest rates above 5% to fight inflation, as well as how high long-term interest rates go to clear the market, so there is no excess supply or a shortage. The 10-year Treasury recently spiked to 5% before settling back a bit as the market adjusts to the prospect of ever-larger Treasury debt actions.
We are actively extending maturities in our bond portfolios to take advantage of higher long-term interest rates, but we will extend gradually because we recognize the possibility that interest rates may rise further. After all, in the six years prior to the Great Financial Crisis, rates averaged 4.5%. We may simply be returning to a more normal rate environment.
We believe persistent high interest rates will put pressure on equity valuations. However, the U.S. economy remains extraordinarily resilient in the face of very restrictive monetary policy. There are many reasons for this, including stimulative fiscal policy, robust household and corporate balance sheets, and a structurally tight labor market. Corporate earnings remain healthy and we believe are likely to resume growing at about 8% next year.
We are in the process of increasing our allocation to credit strategies. High-yield bonds and other noninvestment grade fixed income securities are now yielding 8%-11%, which is an attractive yield, assuming the United States does not enter full recession within the next two years. At present, we believe this is a reasonable assumption.
John Apruzzese is the Chief Investment Officer at Evercore Wealth Management. He can be contacted at apruzzese@evercore.com.
Editor’s note: Evercore Wealth Management supplements its core investment capabilities with carefully selected outside funds across the range of the firm’s asset classes. Among those are the Harbert Management real estate funds, which invest in diverse mid-size multifamily, office, industrial and retail real estate. Here we speak with Jon-Paul Momsen, co-chair of the Harbert real estate platform. Please note that the views of the external managers interviewed in Independent Thinking are their own and not necessarily those of Evercore Wealth Management.
Q: Let’s start with office space, the poster pandemic fallout investment. What is your outlook for the sector?
A: The office sector in general has been the most negatively impacted by the double impact of rising cap rates [an assessment of the annual yield of a property; the net operating income is divided by its asset value] and declining space market fundamentals. With the prospect of declining net operating income and materially higher interest rates, both lenders and buyers have moved away from the sector, resulting in a dearth of available capital not seen in over 10 years and further reinforcing – and exacerbating – the increase in cap rates as a reflection of increased risk. This “one-two punch” has led to significant valuation declines and distress among office landlords.
It remains unclear if work-from-home will evolve and how it will impact overall demand for office space. However, it seems clear that as more companies announce delayed reoccupancy plans, significant layoffs, especially in the tech sector, and employee resistance to returning to the office will continue to put pressure on office fundamentals. These vicissitudes combined with ongoing challenges in the capital markets and an inflationary environment, lead our investment team to the belief that office investment performance and liquidity will continue to be challenging. We expect to see growing distress among existing office owners in the face of debt maturities.
Q: You’ve recently been more focused on multifamily and industrial real estate investments. What do you find attractive in those asset classes?
A: The investment team believes that an opportunity exists in the multifamily sector to generate above-market rent growth by exploiting the wide rent gap between the top of the market and three-star properties. Well-located three-star assets can be enhanced and increased rent realized through targeted renovations and operational improvements. The widespread housing shortage in the United States has been a key driver of apartment performance for the past decade, as a deep and growing renter pool drives demand for new and existing units. This overall shortage, coupled with a growing housing affordability issue, has resulted in the vast majority of renters seeking the value of an affordable rent at a well-maintained workforce housing property with quality, focused management.
The industrial sector produced the highest total returns of all U.S. property types over the past decade, driven by strong cyclical demand that further accelerated during the pandemic. While supply levels are ramping up, we believe strong demand fundamentals support continued industrial outperformance compared to most other major property types. The accelerated adoption of e-commerce and continued population growth are driving significant demand for industrial products and creating investment and development opportunities for industrial space. Importantly, most of our industrial investments are urban-infill, multitenant properties, which were generally purchased on significantly higher initial cap rates than would have prevailed for very large distribution center industrial properties. Given the very tight supply/demand fundamentals for urban-infill industrial properties, we have retained pricing power and been able to drive strong leasing activity and rental revenue increases across the portfolio, resulting in material net operating income growth.
Q: Are there particular geographies that you are targeting?
A: We intend to target metropolitan areas with at least one million people and attributes consistent with outsized economic and demographic growth trends. These markets may possess some or all of the qualities of low costs, high in-migration levels, high educational attainment, and above-average income levels. The fund further intends to focus on metropolitan areas with an outsized concentration of STEM (science, technology, engineering, and math) and TAMI (technology, advertising, media, and information) employment. These conditions are expected to be especially prevalent in the Sunbelt markets targeted by the fund, which have generated outsized economic and demographic growth over the past several cycles.
Q: The combination of higher interest rates and high inflation are creating headwinds for a lot of investors. Where do you see risks for real estate in an economic slowdown?
A: We like to look at real estate from a capital markets and space markets (supply/demand) perspective. From a capital markets perspective, across all property types, the sudden and severe interest rate increases are putting pressure on some borrowers who need to refinance their loan or who borrowed floating rate debt and need to put more equity into a deal to meet interest coverage covenants. In the multifamily market, we expect short-term situational distress for some owners with strong medium- to long-term performance. In the industrial sector, the new-built, big-box logistics market is facing growing headwinds as an unprecedented supply wave meets softening demand; however, in the urban-infill multitenant sector, there is not a supply issue and demand remains robust. Finally, in the retail sector, the combination of COVID stimulus funds, strong job market performance and inflation have driven strong retail sales. We see risk of a consumer slowdown in the face of the depletion of savings account balances and nascent weakness in the job market, which will only get worse in a recessionary environment.
Q: Alternatively, will these macro headwinds provide market inefficiencies or buying opportunities?
A: Historically, market dislocation created by macroeconomic headwinds have tended to create opportunities for experienced, disciplined, and well-capitalized buyers to take advantage of market inefficiencies and to find compelling risk-adjusted acquisition opportunities that provide for long-term value growth.
For further information, please contact Evercore Wealth Management Partner and Portfolio Manager Stephanie Hackett at stephanie.hackett@evercore.com.
Eighty-four percent of portfolio managers underperform their benchmarks after five years, according to Standard & Poor’s. It seems like a damning statistic – and it can call into question the role of active managers in the first place. After all, the goal of active management is generally to beat the market, although we consider additional factors. So, what does it take? And why do so many managers fall short?
Let’s start with the concept of active share. That’s the percentage of holdings in a portfolio that differ from a stated benchmark. A portfolio with holdings and position sizes that match a benchmark, such as the S&P 500 or the MSCI ACWI ex-U.S. index, will have an active share of zero. Passive index funds, which represent the biggest and, for years, fastest-growing segment of the mutual fund market, have zero active share. They won’t underperform their benchmark, but they will never outperform it either.
At the other extreme is a portfolio that holds none of the same securities, resulting in an active share of one. In 2009, two Yale professors established that an active portfolio share of up to 20% really should be considered a passive fund; between 20% and 60% is what they described as “closet indexing.” More than 60% makes for a genuinely active fund.1
One of those professors, J. Martijn Cremers, went on to define the three pillars of successful active management: skill, patience, and differentiation, each of which are related to active share.2 Skill is the first, in determining which investments can perform better than the benchmarks. While active share is not directly related to a manager’s stock-picking talent, a manager with a lower active share is limited in the ability to potentially discover undervalued investments. For a manager with demonstrated stock-picking ability, higher active share can play a significant role in outperformance, net of fees.
Among high active share funds, only those with long holding durations, the second pillar, outperform. Within the quintile of managers with the highest active share, Cremers found that from 1990 to 2015, managers with the longest holding period duration – in other words, the lowest portfolio turnover – outperformed the bottom 60% of managers ranked by duration by about 80% on a net cumulative basis. Managers in the second highest quintile of duration outperformed the same bottom 60% by about 25% on a net cumulative basis.3
The final pillar of active management relates to differentiation, or the opportunity a portfolio manager has to deviate from the benchmark. A manager who is unconstrained from benchmark holdings or other limiting determinants of portfolio construction has the most flexibility and a more likely chance to outperform.4
So where do we fit in? In domestic equities, the largest of our range of asset classes, our concentrated core equity strategy has a relatively high active share: 71% versus its benchmark, the S&P 500 Index, as of the end of the first quarter of 2023. It’s also worth noting that our core equity strategy has a low turnover rate of 12%, as of July 12, 2023; equity mutual funds with turnover between 20%-30% are considered low turnover by Morningstar.5 We take the same approach to fixed income and look for similar characteristics in our external international, credit, and illiquid managers.
We are proud of our performance. But for us, that’s only part of the story. As managers investing on behalf of families, foundations, and endowments, we measure our performance by our success in meeting their financial goals, as well as against our benchmarks. That means focusing on risk-, fee-, and tax-adjusted results – or what we call “real results,” across all our asset classes. That’s what really matters.
For further information on our investment approach and performance data, please contact your Evercore Wealth Management team.
Michael Kirkbride is a Partner and Portfolio Manager at Evercore Wealth Management. He can be contacted at michael.kirkbride@evercore.com.
Joe McManus is a Vice President and Portfolio Manager at Evercore Wealth Management. He can be contacted at joseph.mcmanus@evercore.com.
EWM manages its client portfolios according to each client’s specific investment needs and circumstances. Performance returns within actual client accounts may differ from the EWM Core Equity Strategy due to portfolio management customization, timing of transactions, tax considerations, and other factors. The S&P 500 is the core equity strategy’s benchmark. You cannot invest directly in the S&P 500 index. The S&P 500 is a market-capitalization weighted index that includes the 500 most widely held companies chosen with respect to market size, liquidity, and industry. The EWM Core Equity Strategy holdings will differ from the securities that comprise the index. Unlike the S&P 500 Index, EWM may invest in both U.S. and non-U.S. equities and ETFs. Past performance is no guarantee of future results. All investments involve risk, including loss of principal.
First Half of 2023 Recap
Bank Shake-Up: What Does It Mean for Private Capital Investors?
The global banking crisis put depositors, investors, and regulators on alert, in a period of already heightened market/economic uncertainty. Evercore Wealth Management Partner and Portfolio Manager Stephanie Hackett led a discussion on this changing credit landscape with Frank Rotman, QED Investors Co-Founder, Partner and CIO, and David Golub, President of Golub Capital.
Contact your advisor for replay details.
It’s been almost 25 years since a Japanese economist, Kathy Matsui, put forward the concept of “womenomics” as an antidote to sluggish economic growth. The concept, rooted in a belief in gender equality, was that full female participation in the workforce would generate fresh perspectives, enhance innovation, and boost overall productivity. Few – or at least considerably fewer – people would argue with that hypothesis today. But in that time, female participation in the U.S. workforce hasn’t really budged.
The gains between 1950 and the late 1990s were remarkable with a 260% rise in women joining the U.S. workforce, according to the U.S. Department of Labor. And the economic gains of that period – a fivefold increase in U.S. real GDP – paved the way for Matsui’s theory. But around 1999, when she published her argument (and the Japanese workforce still looked a lot like the U.S. one in the 1950s), U.S. progress in women’s labor force participation stalled. Today, 57.3% of working-age women participate in the U.S. labor force, compared with 68.1% of men.1 The World Bank today ranks the United States about halfway down its list of high-income countries in terms of female labor force participation – still above Japan but well behind that of many other large economies.
Changing demographics, as described in Is Demography Destiny? by Brian Pollak and Where Are the Kids? Demographics in the United States by John Apruzzese, could be seen as bolstering the case for womenomics. If labor, especially young labor, is in short supply in developed economies, encouraging more women to join the workforce would make sense. However, as Brian Pollak observes in his article, an unintended consequence of female empowerment in the workforce has been a decline in fertility rates; families around the world struggle with work-life balance and traditional social mores.
Near term, embracing womenomics in the United States could be instrumental to enhancing economic growth. The broad range of remote work or hybrid options available today may encourage women to seek and retain employment. And higher wages, especially for the lowest paid workers, are making it more economically beneficial to stay in the workforce.
Judy Moses is a Partner and Portfolio Manager at Evercore Wealth Management. She can be contacted at moses@evercore.com.
Here’s an American story.
My mother and my wife’s mother, both children of immigrants, had seven Baby Boomer children between them. Five of the seven Boomers were women who produced nine Millennials, five of whom are women now ranging in age from 33 to 35. They, in turn, have so far produced just one child, my grandson, born last month. If you think about that in the terms used to measure fertility rates, that’s 3.5 for our mothers, 1.8 for the Boomers, and 0.2 to date for the Millennials, well short of the 2.1 replacement rate. We, like many aging families across the country, will need more comfortable chairs at the Thanksgiving table and, if this trend continues, fewer high chairs.
This U.S. demographic trend of falling fertility rates has significant economic and societal consequences. Look at the chart below, showing the changes in expected proportions of the population over 65, 75, and 85. We would need one million additional births per year to reach the replacement rate – and even that wouldn’t make much of an impact on the median age of the population, now 37.7 at the United Nation’s latest estimate, a decade older than the median age in 1960. As populations age and fertility falls here and in other developed and developing countries (see Is Demography Destiny? by Brian Pollak here), the labor force tightens.

Traditionally, consumption also tapers off with age, relieving some pressure on labor. But the Baby Boomers have turned that equation (and all the related economic models) on its head, by working longer in anticipation of longer life spans and by accumulating assets – to the tune of $78.3 trillion gross, or 60% of the total household net worth in the United States.1 While many people are struggling, Social Security, Medicare, and lifetime savings means most seniors are far better off than previous generations. Their spending power is fueled by the markets, rather than earned income, and they are spending in record numbers on restaurants, travel and leisure, as well as healthcare – all areas in which the labor force is particularly tight and getting tighter, with large numbers of unfilled jobs. (Please see Affluent Baby Boomers and Inflation: The Good, the Bad, and Some Options by Jeff Maurer here.) All told, the number of job openings outnumbers unemployed Americans by almost two to one.2
A well-designed immigration policy would go a long way toward alleviating the persistent labor shortage, but unfortunately the politics around immigration make that unlikely. Instead, the best hope for a solution comes from increased capital investment and the resulting productivity – and the good news is these prospects are enticing. We are witnessing a capital spending boom exceeding $3 trillion per year, accelerated by advances in Artificial Intelligence – as billions of dollars are being spent on upgrading data centers with the latest high-speed chips and software development3 – and recent legislation that provides large tax incentives to bring supply chains closer to home and to support investments in green energy.
The record household net worth relative to GDP can provide the capital at reasonable cost through our highly developed capital markets, including the public stock and bond markets, private equity and venture capital funds, as well as rapidly growing private credit funds that are a new source of capital as an alternative to bank loans.
Recently released large language models such as ChatGPT are creating a lot of excitement around AI, but there are many other models that will be tuned to perform many mundane and more advanced tasks that hold the promise of broadly increasing productivity. (Please contact your advisor for a replay of our recent webinar on AI and visit our website to learn more about our planned event on technological developments for seniors.) These advances in AI will reduce and eliminate many tasks and jobs, but they will also create many new jobs. The catch is that the new jobs will require higher levels of education and training. And this is where it gets especially interesting – it just might be the case that education will be a leading beneficiary of an AI productivity boom. Education productivity has lagged far behind most sectors of the economy, which has caused costs to spiral out of control. AI holds the promise of reinventing how we educate and train the next generation.
Our portfolios should continue to benefit from owning both healthcare leaders and the mega tech companies that are at the forefront of creating AI. We control position sizes to avoid the risk of these stocks becoming overvalued as excitement and adaption around these prospects grows. The real work going forward will be finding and investing in the best-managed companies that will lead industry sectors that embrace AI early and achieve a competitive advantage before the technology becomes pervasive. As always, investing in the winners and avoiding the losers will greatly enhance investment returns.
The demographic trends in the United States are already weighing on economic growth. While we may wish for more high chairs at the table, we are optimistic that capital investment trained on productivity-enhancing technology will provide a counterbalancing growth accelerant.
John Apruzzese is the Chief Investment Officer at Evercore Wealth Management. He can be contacted at apruzzese@evercore.com.
The 19th-century philosopher Auguste Comte is often credited with coining the aphorism “demography is destiny.” If so, he had a point. Certainly, shifts in populations – caused by births, deaths, and immigration – can herald transformative societal and economic change. But the interconnectivity among population, innovation, and productivity can make the ramifications of that change difficult to forecast. For years, many believed overpopulation was a looming crisis – that competition for resources would drive us toward a Malthusian dystopia of war, famine, and disease.
Now we worry that declining birth rates and rising longevity in developed and the more advanced emerging market economies may signal the end to almost 80 years of nearly continuous economic growth.
The trends that brought about low birth rates in the developed world – the increasing cost of raising children, improved access to education for girls and women, and female participation in the workforce – are unlikely to be reversed. Instead, they are taking root in many emerging economies too, and at a faster clip. If anything, we have learned that our ability as a global society to affect these developments is limited. And today, with nearly all developed world populations and many of the large emerging market populations already shrinking or set to shrink, countries may hope, in a zero-sum world, to win a relative demographic game – see chart below.
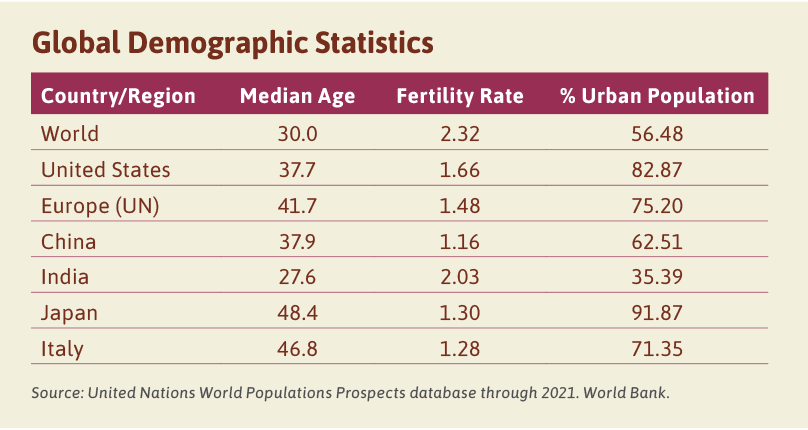
John Apruzzese describes the U.S. demographic outlook in his article, Where Are the Kids? Demographics in the United States; here’s a brief look at a few countries already confronting the challenges associated with dramatically aging populations.
In China, until recently the engine of global growth, the unintended consequences of China’s one-child policy (1980-2016) are now playing out. The fertility rate, measuring the number of children per woman, is just 1.2, among the lowest in the world and far below the 2.1 replacement rate. In addition, China is left with a rapidly aging society, described by some observers as the world’s largest nursing home. The average age is about the same as in the United States, at almost 38 (see the chart below) but is set to rise at a much faster rate, partially due to the shortage of young women. Immigration, the other driver of demographics, is unlikely to be enough to correct the imbalance in such a large and historically insular country.
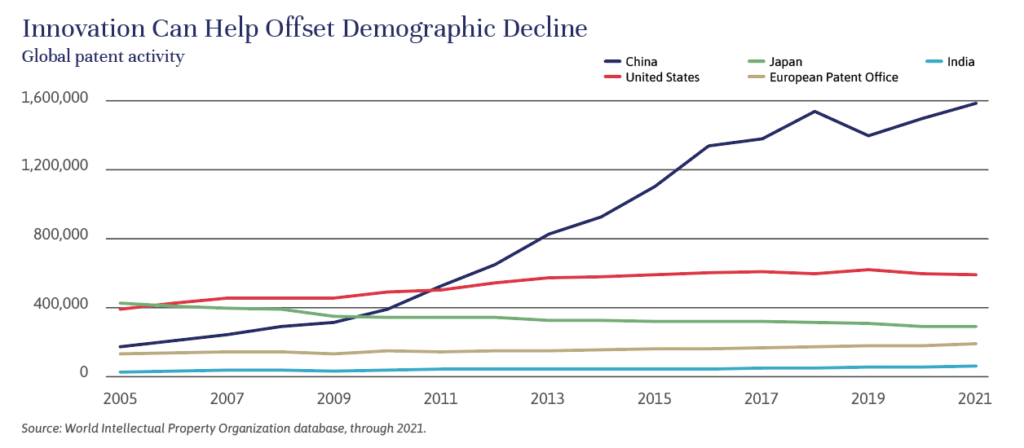
The Chinese government is addressing these challenges by focusing attention on supporting the technology sectors that will help enhance national productivity, including clean energy, robotics, and biological medicine, as demonstrated by the huge rise in patent activity in the last decade. The government also appears intent on boosting China’s ties with the large and growing populations of Africa and the Middle East, outsourcing manufacturing know-how and technology to enhance their manufacturing capabilities and grow their markets. Policy efforts to encourage further urbanization could also help continue to grow per capita GDP, cushioning some of the negative demographic impact. On balance, however, it seems likely that China’s contribution to global growth will continue to deteriorate along with its population.
If you missed our recent webinar on China with Evercore ISI analyst Neo Wang and would like to view it, please contact your Evercore Wealth Management advisor.
Japan has a long experience of demographic decline and has learned to live with a shrinking labor force and population. The country has the oldest population in the developed world, but its standard of living has continued to rise, partially due to its reliance on emerging market workforces. This reliance has enabled the government to retain its domestic focus on creating higher-value jobs and services. Japan is also stemming its labor force shrinkage at present by recalibrating its hitherto unwelcoming policy on immigration and female participation in the workforce. Unfortunately, the latter has coincided with a further decline in the fertility rate, making it clear that there is no easy solution to demographic decline.
In the face of the inevitable acceleration of population decline, many prefectures and cities in Japan are starting to think about how to sustainably shrink infrastructure, including housing stock, retail footprint, rail lines, and healthcare systems. There is little doubt that in Japan, already a technologically forward nation, innovation will be a big part of any solution to demographic challenges. If managed thoughtfully, a shrinking citizenry may not be all bad for this densely populated country.
As more and more of the world faces the same demographic challenges, high-quality labor forces from lower income countries will become harder to source, making it unlikely that the Japan model will be scalable.
This past May, Pope Francis pleaded with the Italian government to enact more pro-growth population initiatives to stem one of the steepest population declines in the world. In the latest count, there are just seven births for 12 deaths; Italy’s fertility rate is the lowest in Europe, and its population among the oldest. Similar to Japan, Italy has been attracting migrants for the past few years, even as its jus sanguinis (“right of blood”) traditions have been hard to shed. As in all developed countries, the high cost of childcare is an impediment, discouraging young couples from having children. Prime Minister Meloni’s administration has proposed lower taxes for households with children, help for married couples purchasing their first homes, and initiatives for free childcare at the community level to allow parents to return to work, but the jury is still out as to their effectiveness.
The European Union has badly lagged Asia and North America in terms of patents and tech start-ups, boding ill for the region’s relative long-term economic growth.
China, Japan and Italy are previews of a global trend. Populations are rapidly aging just about everywhere in the developed world. This will likely result in a shrinking global labor force and declining economic growth. Policies encouraging net migration, female labor force participation (as described in “Womenomics” in the United States by Judy Moses here), and economic incentives for having children are in aggregate unlikely to turn the tide in any specific country, much less around the world. The most successful societies likely will be those that harness new technology to limit the potential inflationary (or deflationary) swings associated with shifts in the relationship between supply and demand in the labor force.
The United States should be among these successes. Although our median age is quite high and our fertility rate is low, the United States has historically – if not recently – excelled (despite recent policy challenges) in accepting and integrating immigrants, and in innovation. Today’s great global technology companies are nearly all founded and domiciled in the United States; many of their founders, not incidentally, are immigrants or the children of immigrants. That technological proficiency could deliver efficiency and productivity gains that will allow easier adaptation to a rapidly changing world.
As long-term investors, we are continually thinking about how demographics will impact the economic landscape. This means focusing on U.S. investments that benefit from the building of much-needed new housing stock (to support Millennial household formation), discretionary consumer spending (aging Baby Boomers), and healthcare (also aging Boomers). Demographic trends inform in part our underweight exposures to Japan, Europe, and China.
Healthcare and the developing technologies that are underpinning most innovations are undoubtedly the big medium-term opportunities. Through individual securities, a dedicated healthcare innovation mutual fund, and venture capital investments, we believe we have found attractive opportunities to invest in healthcare and technology, in both public and private markets.
There’s another way for us all to think about this shift from overpopulation to potentially declining population. If current trends continue, humans will eventually need to find ways to sustainably transition the global economy away from dependence on increasing population. Hopefully, this will be possible through the thoughtful and responsible use of productivity-enhancing technology. If we get it right, we could achieve a better balance between humans and our environment, as well as continued economic growth.
Brian Pollak is a Partner and Portfolio Manager at Evercore Wealth Management. He can be contacted at brian.pollak@evercore.com.
Editor’s note: Evercore Wealth Management supplements its core investment capabilities with carefully selected outside funds across the range of the firm’s asset classes. Here we speak with David Golub, President of Golub Capital, which makes loans to middle market U.S. companies owned by private equity firms. Please note that the views of the external managers interviewed in Independent Thinking are their own and not necessarily those of Evercore Wealth Management.
Q: Please describe the middle market and Golub Capital’s positioning within that market.
A: The middle market generally refers to companies that earn annual EBITDA of between $10 million and $100 million. Private equity sponsors typically buy middle market companies with a view toward growth – for example, expanding into new parts of the country, or rolling up smaller competitors. We provide debt financing to help sponsors acquire and grow their portfolio companies. We primarily make floating-rate first lien senior secured loans at conservative loan-to-value ratios, and we focus on minimizing defaults and credit losses.
Q: What do you see as the opportunities and risks for middle market private debt strategies in today’s complex environment?
A: Our funds performed well in 2022, despite a bumpy investment environment, and we are cautiously optimistic we will be able to extend that strong performance into 2023. Yes, there are some widely recognized headwinds: Higher rates, inflation, tight labor markets, recent strains in the banking system and a slowing economy mean we are likely to see more credit stress in 2023. There are also tailwinds, arguably more powerful. The combination of higher base rates, wider spreads, lower leverage levels and tighter documentation terms means that the expected return on new loans has increased – and, at the same time, there’s a greater margin of safety. Indeed, we believe we are in one of the best environments for making new loans that we’ve seen in our 28-year history.
Q: When credit spreads rise, as they did in 2022, on loans that are in the portfolio, how is the price of those loans impacted and how is that reflected in the overall portfolio’s mark to market?
A: In general, when credit spreads rise in the market, the fair value of existing loans is marked down. Intuitively, the contractual interest rate of the existing loan is below the current market rate for an identical new loan, so a buyer of the existing loan in today’s market would demand a discount to face value to make up the difference. This kind of fair value markdown is called an unrealized loss. The good news about unrealized losses is that they don’t matter in the long run unless they become realized losses – in other words, if the loan isn’t repaid in full. So we are laser-focused on avoiding realized losses. As long as we avoid realized credit losses, fair value markdowns should reverse over time as borrowers pay off, or as their credit attributes improve, or as credit spreads decline in the market.
Q: Do you believe that we will see a significant default cycle in this current economic environment? If so, what steps are you taking to limit defaults and maximize recoveries across the loan portfolio?
A: Last year and the coming period should, in our opinion, give lenders their most important “credit report card” since the financial crisis. Whether there’s a recession on the horizon or just more muddling growth, we expect to see greater dispersion in the performance of middle market companies and, by extension, lenders to those companies.
So far, we are pleased with the way our borrowers have adapted to slowing growth and higher rates; the portfolio’s performance ratings are strong, and nonaccruals and defaults remain very low. But given the potential for a hard landing, we are also taking extra steps to screen our borrowers for vulnerabilities. We have always believed that early detection of risks and early intervention to mitigate those risks are critical for limiting credit losses. We believe it takes scale and experience to do this well. We’re not going to be 100% right – that’s not a realistic goal. Our goal is to detect which of our borrowers are at higher risk and then to have early discussions with sponsors and management teams about how to make them more resilient.
Q: Are there any sectors that you think are particularly attractive in this environment? And are there any sectors that you have traditionally invested in that you are avoiding today?
A: Our lending strategy focuses on industries and subsectors that we believe are recession-resistant and where we believe we have deep expertise – industries like mission-critical enterprise software, and veterinary hospitals and specialty distribution. The sectors we think are particularly attractive today are not different from usual. One reason why this matters now is that we expect private equity firms in this uncertain environment to focus less on acquiring new platforms and more on growing their existing portfolio companies. We believe the implication is that there likely should be robust demand for add-on financing from companies in sectors we like where we’re the incumbent lender. In terms of sectors we’re avoiding, that hasn’t changed much either. We tend to avoid industries that are tied to interest rates like home building or auto, or companies that are exposed to volatility in commodity prices or foreign exchange.
Q: A lot of capital has flowed into both private equity and private debt markets over the past decade, but over the last 12 months to 18 months, it appears that capital flows have slowed materially. How should investors think about the outlook for private debt?
A: While capital flows have slowed recently, the stock of private equity dry powder is remarkably high. Reports indicate it is approaching $2 trillion. As this dry powder is deployed, we expect the private equity ecosystem to double in size. This should lead to large increases in demand for private debt in an environment in which the amount of private debt dry powder is much lower than the amount of private equity dry powder. We think the current outlook suggests a sustained supply-demand imbalance that favors lenders.
Within the world of private debt, we see two dominant themes. The first theme is that the big and strong are getting bigger and stronger. This is because private equity firms don’t want to have relationships with dozens of lenders – they want to have a core group of relationships with lenders that can do a lot of different things for them. For example, sponsors want to work with lenders that can finance their small deals as well as their large ones, offer a broad suite of creative solutions, bring subject-matter expertise to the table, and scale up as their portfolio companies grow. The second theme is that private debt solutions are gaining share from the broadly syndicated loan market. Growth among leading private lenders has enabled the private debt market to finance larger and larger transactions. And sponsors are finding that these private solutions can be very attractive for a whole range of deals that until recently would have been done in the broadly syndicated market – deals where there’s a critical component like confidentiality, certainty of execution, or capacity to grow over time that the broadly syndicated market just isn’t well suited to deliver. Both of these dominant themes play to the strengths of leading large-scale lenders.
For further information, please contact Evercore Wealth Management Partner and Portfolio Manager Stephanie Hackett at stephanie.hackett@evercore.com.
Since ancient Mesopotamian farmers borrowed seeds with the promise to share their crop to pay off their debts, credit has supported economic growth. Trust, which is the Latin meaning of the root word cred, is the foundation of lending. The greater that conviction, the better the terms for the borrower. But, as we’ve come to appreciate through the centuries, the greater the risk, the greater the potential investment return for the lender.
Global credit markets now represent approximately $40 trillion in capital, spanning corporations, municipalities, real estate, autos, and unsecured consumer credit, across both liquid markets and private, illiquid markets.1 While we invest the defensive portion of balanced portfolios predominantly in high-quality, investment grade municipal, corporate and Treasury securities (as these securities tend to rise when the economy and equity prices are weak), this higher interest rate environment provides additional opportunities in credit-sensitive investments.
The best-known credit sector is probably the corporate bond market, which got going when the Dutch East India Company borrowed money to finance trade routes in the 1600s. It grew over the subsequent centuries, focused on lending money at low yields primarily to the largest, best capitalized companies, with the strongest balance sheets and lowest risk of default.
This market took on a whole new life in the mid-1980s when investment banker Michael Milken of Drexel Burnham Lambert helped finance companies issuing what became known as “junk bonds” or high-yield bonds. These were bonds issued by companies considered by the market to be risky, usually due to a highly leveraged balance sheet or an uncertain business model. Suddenly, lending to low credit-quality companies at high yields took off, not just financing private equity leveraged buyouts, or LBOs (Milken’s specialty), but allowing corporations of all sizes and shapes access to relatively inexpensive and available financing.
While the trajectory has not been a straight line, facing various difficulties in the savings and loan crisis of the late 1980s and, later, the Great Financial Crisis, the high-yield bond market continued to democratize the credit markets, providing capital to more and more issuers. While Milken himself is a controversial figure, most economists agree that the advent of more accessible capital to higher risk corporate borrowers has been a tremendous boon for economic growth and innovation over the last four decades. Amazon, Netflix, and Tesla are just some of the companies that were able to access capital at challenging moments in their respective histories.
Today, the global liquid corporate high-yield bond and loan market includes 2,000 issuers and represents over $3 trillion in market capitalization.2
The securitized bond market rivals the size of the corporate bond market globally. Securitization is the process of taking certain types of assets, typically loans, and pooling those loans so they may be repackaged as marketable securities, in which the interest and principal payments are passed through to the purchaser of the new security. While investment history buffs can trace its origins to farm railroad mortgage bonds from the 1860s, the modern era of securitization began in the early 1970s. That’s when government agencies, starting with Federal National Mortgage Association, better known as Fannie Mae, began issuing residential mortgage-backed securities, allowing capital to flow to where it was previously lacking, including low-cost or affordable housing. The Tax Reform Act of 1986 further empowered issuers with greater flexibility to structure bonds with varying maturity and risk profiles.
The securitized markets then expanded to assets far beyond residential mortgages, including mortgages secured by commercial real estate properties and automobiles, and various unsecured consumer credit, including student loans and credit cards. Immense growth came at the expense of quality underwriting, however, and the securitized market came to a grinding halt in 2007. But underwriting and lending standards have since improved significantly, and the industry is now on solid footing, and continues to provide more and more avenues for small businesses and consumers to access debt capital.
Private credit markets, which contain loans that are either smaller or more complex than those available in public markets, have also grown exponentially since the financial crisis. Private lenders today provide capital to the over 15,000 small or middle market companies that are not traded publicly.3 Global private debt has a total market capitalization of over $1.4 trillion, up from $250 billion in 2010, as illustrated by the chart below. This rapid growth in private lending has provided capital to an increasingly diverse set of companies, by expanding access beyond local bank lending offices to the often more robust and creative private capital market lenders, helping the companies to grow, hire, and combine. Please see the interview with David Golub, one of our longtime external managers, focused on middle market lending.

We’ve come a long way from seed-based loans (although it’s interesting to note that credit still underpins the global food supply). The credit market, both private and public, has weaved its way into once idiosyncratic areas, creating risk-adjusted opportunities that the Dutch East India Company and Mesopotamian lenders might have marveled at – including in high-yield corporate bonds, securitized bonds, and various investments in private credit. All of these look more appealing now after a brutal 2022, in which most credit-sensitive investments saw prices fall and yields increase – for instance, the Barclay’s U.S. Corporate High Yield Index fell by over 11%, and yields increased to over 8% from just over 4%. It will be interesting to see how credit lending continues to evolve. At present, diversified credit investments with appealing risk-adjusted return profiles, in the public markets and, where appropriate, private markets, seem to us a reasonable component of our fixed income portfolio asset allocation, in addition to Treasuries, and corporate and municipal bonds.
Brian Pollak is a Partner and Portfolio Manager at Evercore Wealth Management. He can be contacted at brian.pollak@evercore.com.
For almost 13 years, the very best investment returns came from some of the best-known components of the easiest-to-invest-in asset class. From the beginning of 2009 to the end of 2021, the larger the allocation to four companies – Alphabet/Google, Apple, Amazon, and Microsoft – generally, the better the returns.
These household names dominated what became known as the mega caps, the three dozen or so companies valued at more than $200 billion, most based in the United States. Together, the four accounted for more than 20% of the S&P 500, with annual profit margins of around 18% for MegaCap-8, or 1.5 times the S&P 500 average and two times the MSCI World Large Cap average, as illustrated by the charts below. They were, as we wrote a year ago in Independent Thinking, among the most successful companies in the 200-year history of limited liability corporations.1
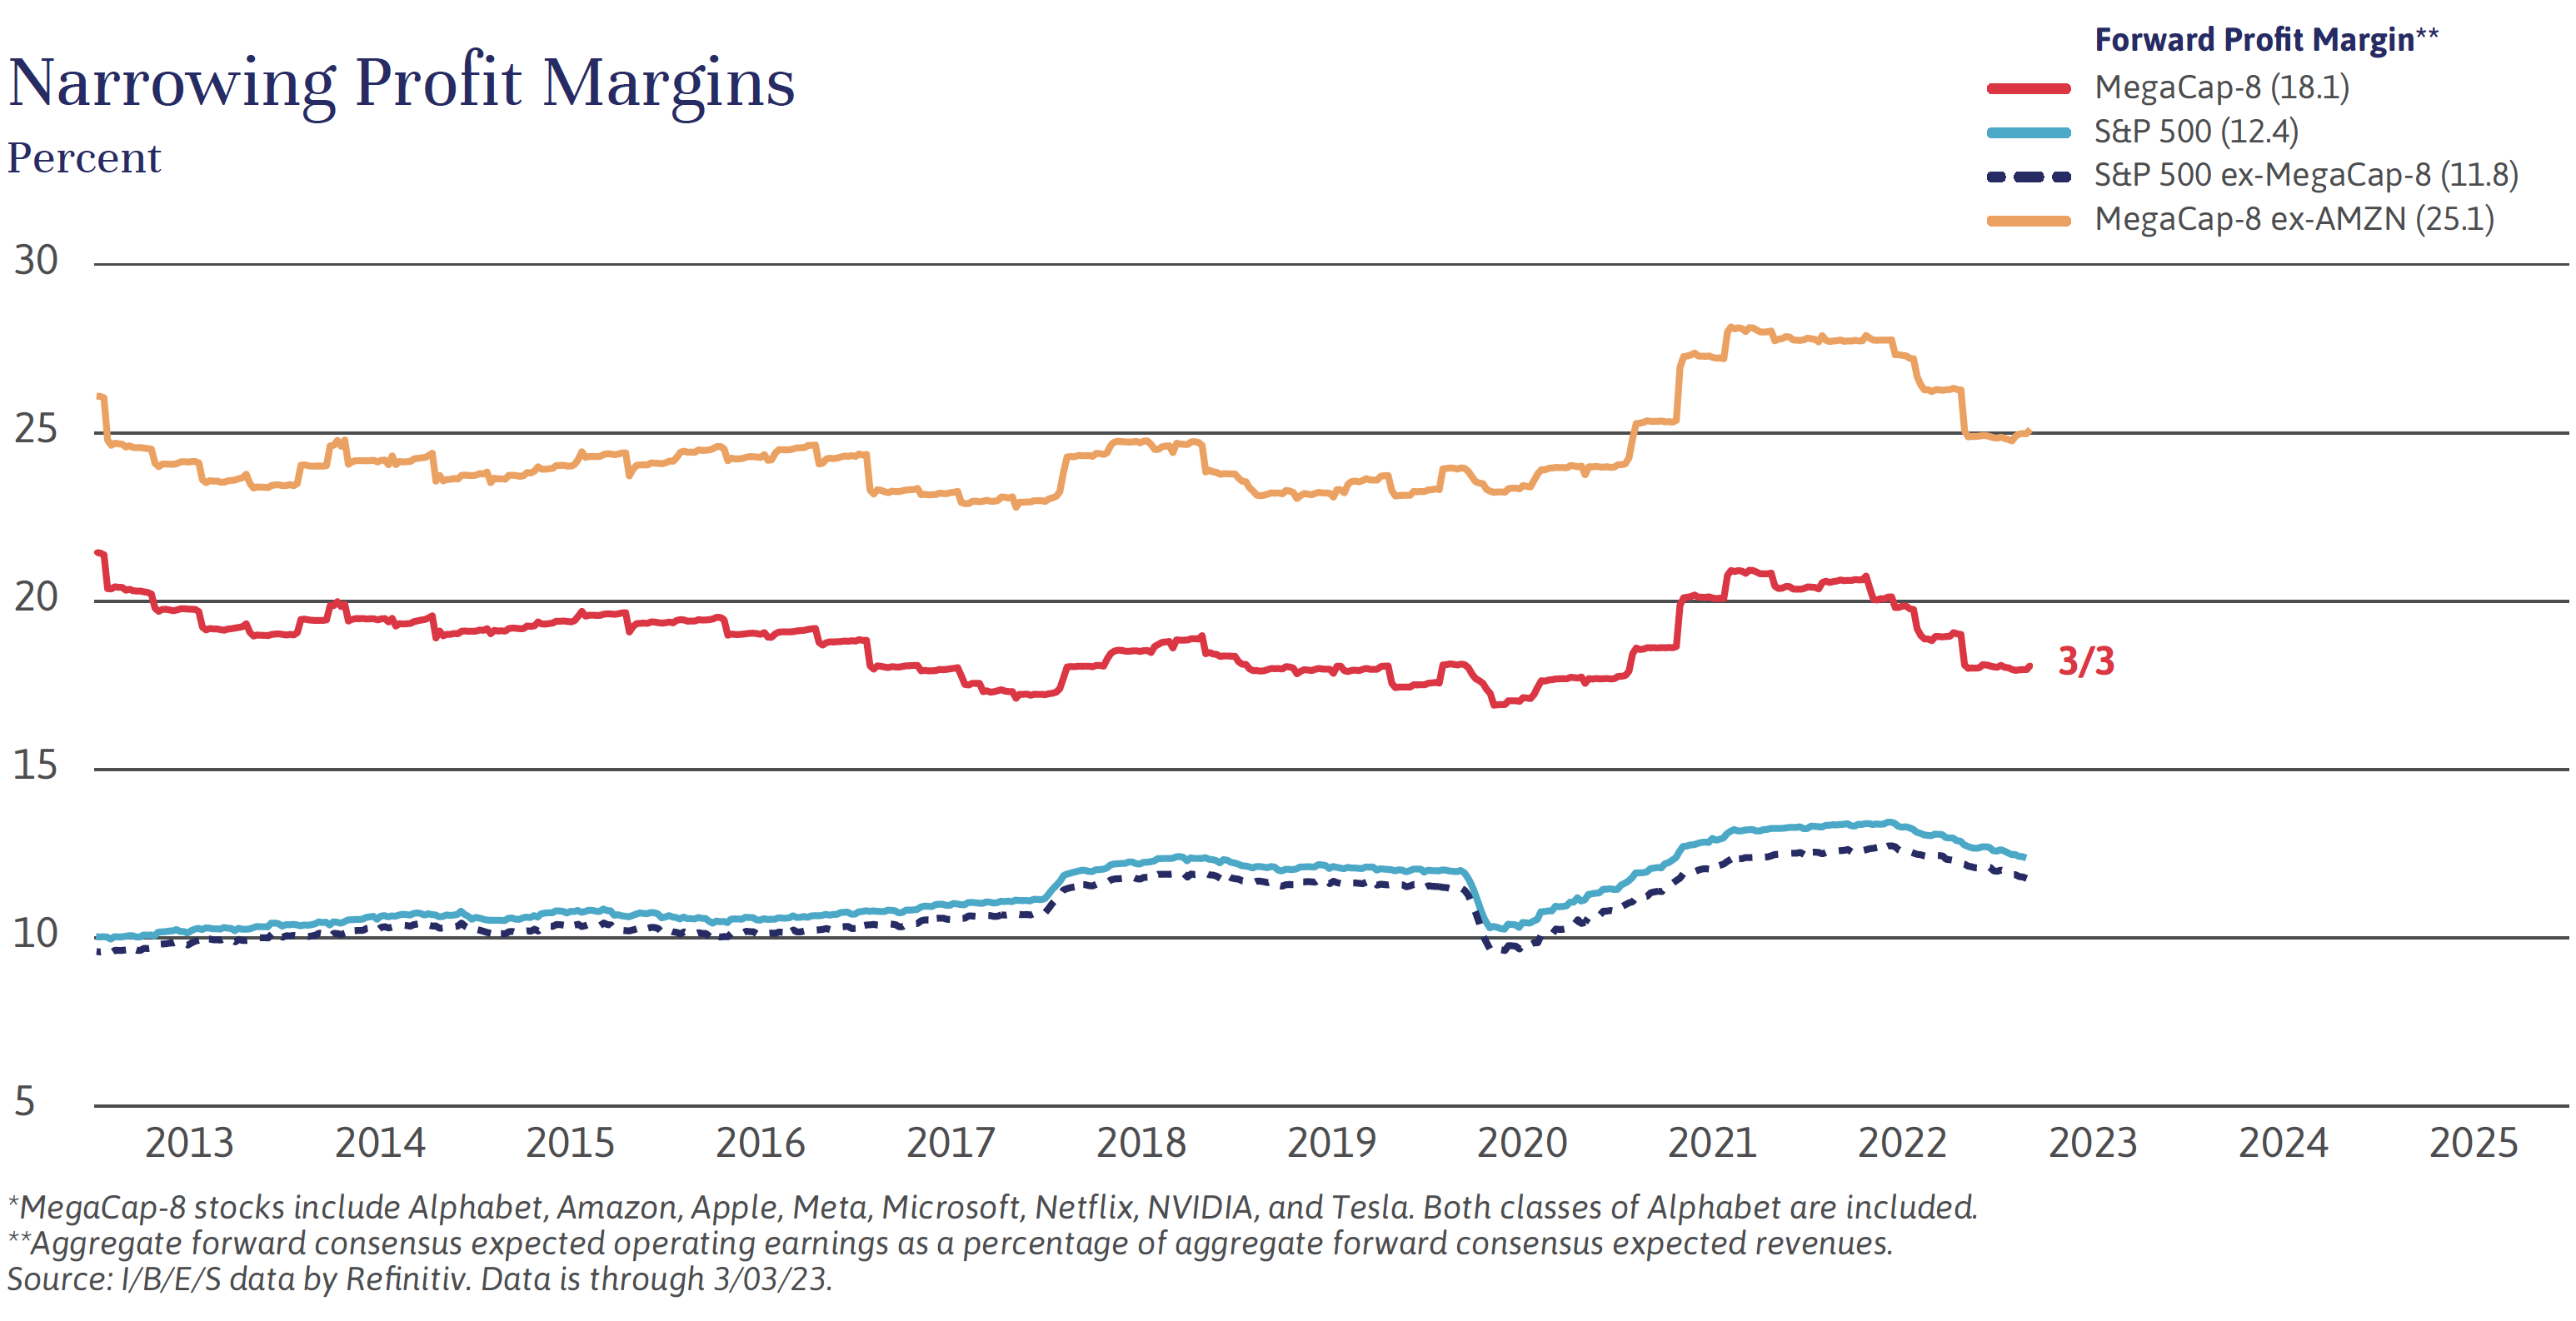
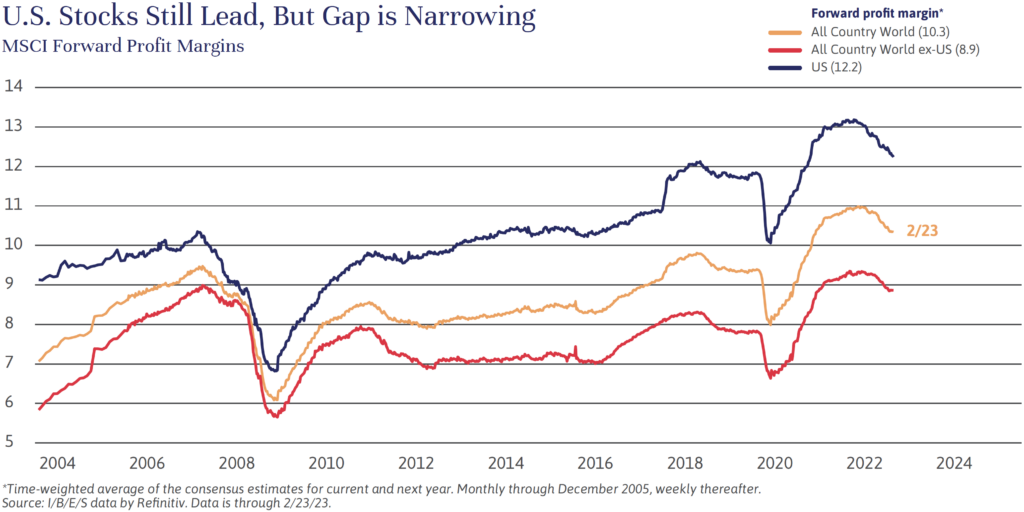
That era ended a year ago, on March 16, 2022, when the Federal Reserve started reversing monetary policy to combat rapidly accelerating inflation. The S&P 500 index fell 25% between January 3, 2022, and October 12, 2022, and the mega caps fell harder still. One reason was that the big companies had much higher valuations than the broader market at the peak, and higher interest rates devalued investors’ perceptions of future growth.
Today, the valuation gap between these companies and the rest of the market looks likely to continue to narrow, as their growth rates decline from the technology spending boost caused by the pandemic and the extraordinary success of cloud computing – and as governments around the world attempt to rein in their near monopolistic power.
Although we continue to believe that the power, resilience, and business models of many of the biggest U.S. technology companies will lead to strong future returns, we do not expect a return to the recent level of U.S. mega cap dominance. Instead, it seems to us that the better diversified a portfolio, generally, the better the likely future returns. We are trimming our exposures to the mega caps that have served our clients so well in favor of three asset classes: international equities, credit, and illiquid assets. Let’s take a brief look at each.
International (excluding U.S.) equity markets, which significantly underperformed U.S. stocks over the previous era, have reached historically low valuation levels in absolute as well as relative terms. A warm winter in Europe has helped the region avoid a major energy crisis and bought European Union countries time to wean themselves off Russian natural gas. And a faster-than-expected reopening in China has offset the economic impact of the country’s three-year zero-COVID policy. At the same time, the U.S. dollar is well off the highs of last year, which takes the pressure off most emerging markets that borrow in dollars. We recommend allocations to equities in developed international and emerging markets, but still at a weight far below the approximately 40% exposure in the MSCI All-Country World Index. Due to the long-term underperformance in international stocks, in many cases we are actively rebalancing international weightings back toward policy, which is approximately 15% of equity portfolios.
Interest rates have moved up dramatically across the major fixed income markets since the Federal Reserve started increasing rates last March, and they are beginning to show attractive real rates based on consensus long-term inflation expectations of about 2.7%. A Credit History, Built on Trust and Innovation by Brian Pollak and the interview with David Golub of Golub Capital explore opportunities becoming available in the credit markets. For balanced portfolios, we currently recommend a portfolio allocation of between 5% and 10% to liquid public and illiquid private credit.
Of course, we cannot assume that inflation is reverting to 2% in a straight line; it will be important to orient part of the portfolios to investments that should do well in an elevated inflation environment. We have moved our core equity portfolio weighting to commodity producers, significantly higher, and on the fixed income side we are looking for opportunities to enter positions in inflation-protected bonds, to complement our exposures to Treasuries and municipal bonds.
We also continue to search for additional opportunities within the private equity, venture capital, private debt and real estate markets within balanced portfolios that can bear illiquidity risk, including diversified private real estate, private equity secondaries funds, and distressed or special situations debt funds.
In the interim, where appropriate, we will continue to take gains, if available, from the big-cap tech stocks as tax efficiently as possible and to rebalance portfolios. The era we are entering should present many investment opportunities, as well as many risks. We believe thorough diversification is the best strategy to deal with the rapid changes, risks and opportunities that investors currently face.
John Apruzzese is the Chief Investment Officer at Evercore Wealth Management. He can be contacted at apruzzese@evercore.com.
Howard Cure, National Director of Municipal Bond Research, writes in “Mass Transit Systems: Lawmakers All Aboard (For Now)” that there may be opportunities for bond investors in this sector. However, he notes that questions remain around the long-term impact of hybrid work.
If you would like to read the article, click here. If you have any questions, please contact your Evercore Wealth Management Advisor or email wealthmanagement@evercore.com.
Editor’s note: Evercore Wealth Management supplements its core investment capabilities with carefully selected outside funds across the range of the firm’s asset classes. Here we speak with David Samra, a managing director of Artisan Partners and a founding partner of the Artisan Partners International Value Team. Please note that the views of the external managers interviewed in Independent Thinking are their own and not necessarily those of Evercore Wealth Management.
Q: The convergence of high inflation, rising interest rates and slowing growth is driving volatility in all major markets. How should U.S.-domiciled investors think about investing internationally now?
A: As fundamental investors, we invest in companies, not stock markets. The distinction is meaningful in that we take a highly researched, fundamental approach to investing in businesses that are competitively advantaged globally and have the market position, financial resources and management talent to prosper through all types of economic environments. That is fundamentally different than a security, such as an ETF, that simply provides exposure to a region or a factor. One difference that we would point to today is the overvaluation of the U.S. dollar on just about any measure. We believe the non-US. Equities we own in our portfolio today are not only attractively valued, but also offer exposure to currencies that are meaningfully undervalued.
Q: What risks and opportunities does the strong U.S. dollar present for companies in your portfolio?
A: Many of the multinational companies in our portfolio are today benefiting from increased earnings from their U.S. dollar operations. While we believe the dollar today is overvalued, we also believe it puts several of the businesses in the portfolio in an incrementally advantaged position on labor and certain material costs that are commonly not priced in dollars. However, there are a few companies in the portfolio that source raw materials in dollars, and it will take time before price increases in local currency can fully cover those costs.
Q: Let’s look at some specific regions, and their potential impact on the portfolio. How do you view recent events in China, in the context of your investments?
A: China’s geopolitical issues, unfortunately for the rest of the world, create certain frictional costs, such as the need to adapt supply chains. That need will add to already high inflation pressures. Another frictional cost is the reduction in foreign direct investment in China. Companies around the globe have curtailed Chinese investment, which will further slow one of the world’s largest economies. One must also consider the newly emboldened centralized Chinese government that is increasingly involved in the affairs of private enterprise. This approach to economic management over decades created inefficiencies and hampered efficient wealth creation. We have invested a small portion of the assets in the portfolio in what we believe are a few well-run and well-positioned Chinese businesses that are trading at valuations we have not experienced in our career.
Q: About half of the companies in your portfolio are in the European Union. How do you see them managing their current economic challenges, notably higher energy costs?
A: Higher energy costs are a global phenomenon, though certain parts of Europe have a time-constrained need to replace Russian gas and are experiencing a significant increase in those costs. Of course, that will likely lead to a tax on consumption and a reduction in profit margins for companies that do not have the ability to pass on those higher costs.
Q: British management teams are struggling to keep up with changes in government and policy. How would you describe the investment outlook there?
A: We believe the United Kingdom is facing some near-term fiscal and political challenges that will create economic headwinds. As a result, share prices have declined significantly. As with the United States, U.K. culture and the corporate governance system provide an incredible foundation for corporate value creation. The United Kingdom has always been a somewhat outsized focus for our investment portfolio. Today’s challenging situation allows us to parse through falling share prices and invest selectively in what we believe are higher-quality businesses at very attractive valuations.
Q: As part of your investment process, you calculate an estimate of intrinsic value for companies. Given the declines in the equity markets, what type of discounts to intrinsic value are you seeing for companies in your portfolio?
A: The Artisan International Value Fund was launched in 2002. We have since tracked what we call the portfolio’s discount to intrinsic value. The discount represents the difference between the market value and fair value of the securities owned in the portfolio. That discount has ranged from a low of approximately 5% to a high in the mid-40s over the last 20 years. Today the portfolio is trading at the highest end of the historical discount range.
Q: More specifically, Samsung Electric has been one of your larger holdings for some time. It has been a tough year for many technology companies, but particularly tough for semiconductor companies. What are some of the issues affecting Samsung currently, and how do you see those issues getting resolved?
A: Samsung Electronics is a vertically integrated manufacturer of technology and consumer products. The basis of the company’s competitive advantage comes from the internal manufacturing at scale of components including panels, displays, optical semiconductors, application processors and memory chips, including DRAM and NAND. Samsung is the world’s largest manufacturer of memory chips due to significant scale and technological leadership. Today, the DRAM and NAND markets are oversupplied, resulting in falling prices that have hurt reported operating profits. The market for memory chips is today characterized by excess inventories, growing demand and falling supply. Eventually, we believe excess inventory will be worked down through growing demand and supply cuts, which should move prices back to more normal levels. Once Samsung’s profit begins to recover, we would expect the share price to follow.
For further information, please contact Evercore Wealth Management Partner and Portfolio Manager Judy Moses at moses@evercore.com.
Tax-loss harvesting means selling an investment at a loss to offset capital gains. Over the last 20 years, it’s been applied to stocks, which tend to be more volatile than bonds. But the recent and severe bond market dislocation has provided investors with harvesting opportunities in both markets.Quite simply, this means selling shares of a loss-making security and applying the loss against realized gains taken in other investments. Critically, the security must not have been purchased under 31 days before the sale, or repurchased in under 31 days after the sale. Repurchasing in under 31 days triggers what is known as a wash sale and negates the realized loss for tax purposes.
The most straightforward approach is simply selling the investment at a loss, be it a mutual fund, an exchange traded fund, a stock, a bond, or another investment. By selling and realizing the loss and keeping the proceeds in cash, assuming the wash sale rule is respected, the loss can be used against realized gains.
Alternatively, the loss-making investment can be swapped for a similar, albeit not identical investment, such as a closely correlated index fund or individual security, to maintain the overall asset allocation. It’s important to note that the newly purchased security must be sufficiently different from the sold security; for instance, selling one S&P 500 index fund and buying another would trigger a wash sale, as would selling and buying the same fund or security through different investment vehicles. For a bond tax-loss swap to avoid the wash sale rule, it must have at least two of the three following characteristics: a different issuer (name of the issuing entity); a different coupon; and a different maturity. This rule provides the bond manager enough flexibility to take tax losses across a bond portfolio and avoid wash sale rules, while maintaining the basic duration, liquidity, and credit quality of the portfolio.
Keep in mind that gains and losses incurred on investments held less than a year are taxed at higher rates than those on longer-term investments. There can also be transaction costs to consider.
Efficient tax-loss harvesting requires careful planning and close consultation with your portfolio manager and tax advisor. But the right tactical moves, in the context of a well-thought-out investment strategy, can help support the long-term goals of income and capital appreciation, even at the end of a very challenging year.
Michael Kirkbride is a Managing Director and Portfolio Manager at Evercore Wealth Management. He can be contacted at michael.kirkbride@evercore.com.
To learn more about tax-loss harvesting, please view Michael’s recent video at https://www.evercorewealthandtrust.com/tax-loss-harvesting-pros-cons/.
Purchasing power parity, which is calculated by measuring the price of a specific basket of goods to compare the absolute purchasing power of one currency to another, indicates that the U.S. currency is at a 37-year high. Relatively aggressive monetary tightening in the United States and increased global geopolitical risks are prompting investors worldwide to buy dollars.
The U.S. dollar hasn’t been this strong since 1985, right before representatives from West Germany, France, the United Kingdom, Japan, and the United States met at the Plaza Hotel in New York City with the shared goal of driving the dollar down, to improve the global trade balance. That degree of collaboration this time around seems unlikely and, as yet, unwarranted, but investors everywhere might have reason to hope that the dollar loses at least a little steam.
Just how strong is the greenback? It’s up by approximately 12% against the euro, 15% against sterling, and 20% against the yen from the beginning of the year through early November. All told, it’s gained more than 10% over the same period on a trade-weighted basket of other currencies, measured by the U.S. Fed Trade Weighted Real Broad Dollar index and illustrated below. That’s largely because the Federal Reserve started hiking interest rates to combat inflation earlier and more aggressively than many other central banks. While other central banks, including the European Central Bank and the Bank of England, are now raising rates, they don’t appear willing to go the same distance.
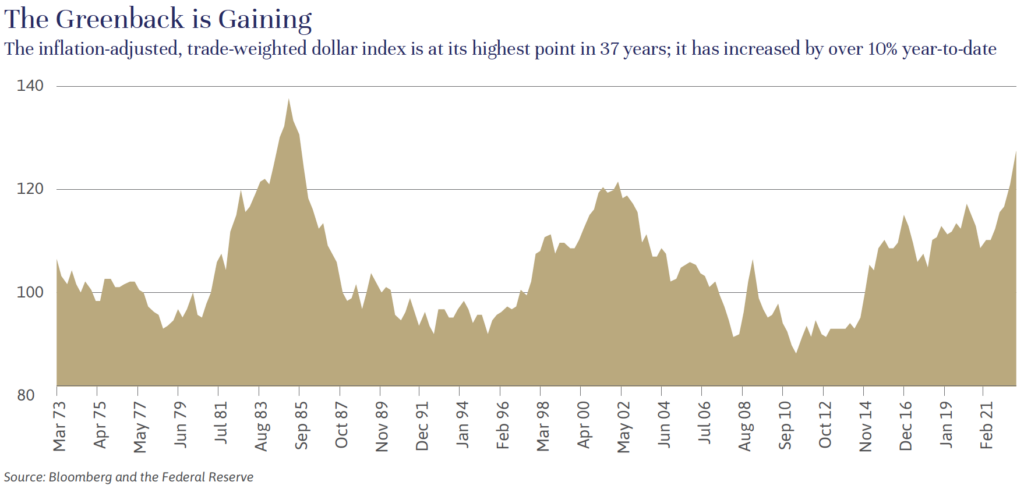
There are other factors driving the dollar’s strength. As it’s perceived by investors around the world as a safe-haven currency, the dollar typically rises during periods of economic weakness or on geopolitical shocks – and we’ve had no shortage of those over the past year. The dollar soared after the Russian invasion of Ukraine on February 24, 2022, and the gains have accelerated since.
Of course, a strong dollar has its benefits, as Americans opting for the Hôtel Plaza Athénée in Paris over The Plaza in New York this holiday season can testify. And back at home, U.S. consumers and companies are saving on imported goods and services. But it’s bad news for our trading partners, for most emerging markets, and, ultimately, for Wall Street.
Around 40% of global transactions are in U.S. dollars, according to the International Monetary Fund (IMF), notably in agriculture and energy commodities. This makes it, as John Connally, Richard Nixon’s Treasury Secretary, bluntly put it back in 1971, “our currency, but [Europe’s] problem.”
Liquid fuels, which are priced in dollars, have risen by 79% in euro terms year over year through September 30, 2022, substantially more than the 58% rise recorded over the same period in the United States. Interestingly, countries with their own agricultural and energy sources, such as Mexico and Brazil, have seen their currencies hold their value. But those who are not self-sufficient are struggling. That’s particularly true for countries with high U.S. dollar debt burdens, as they are having to pay back coupons and principal using their depreciated local currency, causing their deficits to balloon when they can least afford it.
Indeed, some economists are starting to worry that this crucible of inflation and debt could force a credit crisis. Speculation that Japan has recently sold a small bit of its over $1.2 trillion in U.S. Treasuries to support its currency suggests that central bankers may be thinking the same thing. However, trouble in a smaller, still developing market, such as Colombia or Argentina, seems to us more likely, with correspondingly smaller knock-on effects.
A big risk to U.S. investors of continued dollar strength is in the stock market. Although the United States is a net importer, between 30%-40% of the market-weighted sales of S&P 500 companies are international. A strong dollar has a direct negative impact on these companies’ revenue and earnings and therefore is likely to show up in the earnings of the broader market. While difficult to isolate, some analysts estimate a 2%-3% negative impact to earnings over the course of the year based on present foreign exchange rates.
Further out, a natural catalyst for a correction in the dollar’s value would be the resumption of strong global growth alongside lower inflation, which would allow the interest rate differential between counties to close. But the IMF expects global growth to slow to 2.7% in 2023, down from a projected 3.2% for 2022 and 6% for 2021. Meanwhile, inflation is expected to decline to a still too high 6.5% in 2023, down from 8.8% projected for 2022. Full normalization may be some time off.
What if more intervention is needed in the interim? While we don’t expect that at present, it’s certainly worth considering. Would we see collaboration again on along the lines of the Plaza Accord or, more recently, during the Great Financial Crisis of 2008-2009 and in the early days of the pandemic? It’s hard to say; China is marching to its own beat and the Group of 7 reaffirmed its commitment to non-intervention in currency markets just a few months ago. We have to hope that we would once again see willing and competent coordination if and when it’s needed.
Brian Pollak is a Partner and Portfolio Manager at Evercore Wealth Management. He can be contacted at brian.pollak@evercore.com.
The 2020s have so far brought us some of the best times in the markets and some of the worst.
As we look to 2023 and beyond, it’s worth taking stock and reviewing our asset allocation.
There are plenty of factors at play, but the biggest by far is inflation. Unacceptably high and surprisingly persistent inflation, the consequence of poor fiscal and monetary policy in response to the pandemic, has forced the U.S. Federal Reserve to increase short-term interest rates sharply, with promises of more rate hikes to come. That’s driven up long-term interest rates from very low levels, to 3.8% from 1.5% in just 11 months, and forced down valuations across all major asset classes.1
When the Fed increases interest rates at this clip, a recession usually follows. At this juncture, the question really is whether it will be a mild recession – sometimes referred to as a rolling recession, in which case earnings are flat to slightly down – or a more meaningful recession, with earnings down 10%-20%. If it is a mild recession, then chances are that we have probably seen the market low for this bear market. However, if we have a recession that causes earnings to fall by 10% or more, we would expect the market to fall to new lows.
There are a number of reasons why we put a slightly higher probability on a mild recession, several of which are illustrated below.
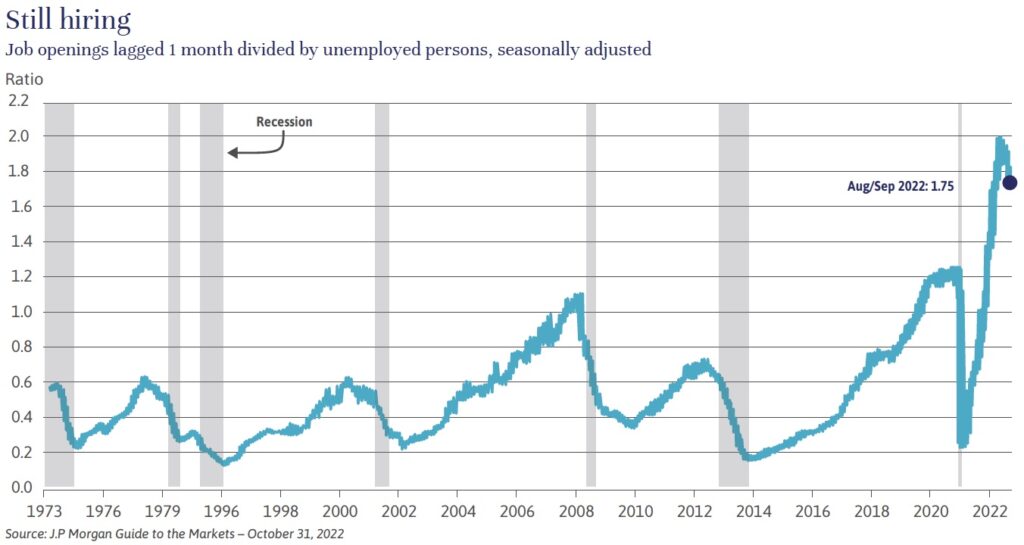

First, we have a very strong jobs market, with a record number of open jobs relative to unemployed workers, and strong wage growth. So, we are a long way from a large increase in the unemployment rate that would usually accompany a major recession.
Second, U.S. household balance sheets are very strong, with relatively low debt levels, high net worth and considerable excess savings lingering from the government largess during the pandemic.
Third, a deep recession is almost always accompanied by a financial crisis. While it is admittedly difficult to identify a financial crisis before it happens, we do not see the early signs of one in the United States. The use of excessive debt, which is the usual precursor to a crisis, is at the government level this time around – as opposed to the corporate or household level. This has significant implications long term but should not cause the more typical financial crisis in the private markets.
Fourth, the pandemic and shift to remote and hybrid work has helped hone some great American companies. Superb management teams are generating record-high profit margins, even adjusting for low interest rates and taxes, and corporate earnings growth well in excess of overall economic growth. With reduced future profit expectations, it follows that solid returns can be achieved in the future if markets rise, a good thing considering that higher normal future returns will be required to overcome higher rates of inflation. This is an important positive factor worth keeping in mind against an admittedly still difficult backdrop.
Further good news is that even with a recession on the horizon, our 10-year expected returns for all the major capital market asset classes are up considerably from a year ago. We now expect close to 4% or more on cash equivalent investments. And we expect about a 4% tax-free return on high-quality municipal bonds, up from 2% or lower not that long ago, and about a 7% taxable return on credit strategies that take on credit risk. Most important, now that the valuations on stocks are back to, if not slightly below, historical averages, we believe the 10-year expected returns on stocks are close to the long-run returns of 9%-10%.
Here’s another, counterintuitive, positive. Negative news – which we have had plenty of this year – breeds negative sentiment, which historically bodes well for the markets. At present, we are at record lows on many measures of sentiment, which are reflected in current reasonable-to-cheap valuations. Lower valuations may set us up for favorable long-term future returns. Even the expected returns for international equity markets are up, due to extremely low valuations, which could be argued fully reflect current challenges – energy prices and a very strong U.S. dollar. (See Dollar Exchange Rates: Too Much of a Good Thing? by Brian Pollak here.)

There’s no doubt that 2022 has been a tough year in the markets. But we need to retain our perspective, keeping in mind that we previously enjoyed a 10-year strong bull market and truly extraordinary gains between March 2020 and the end of 2021. We are continually evaluating our portfolios and evaluating whether to take losses where possible to offset any realized taxable gains. We do see opportunities, among individual stocks that are at valuation levels well below their historical averages, and in extending maturities within our bond portfolios. We are also continuing to invest in real estate and other carefully selected illiquid alternative investments, which generally represent about 10% of our balanced portfolios.
The Fed has made it very clear that it will do whatever it takes to get inflation back down to an acceptable level. No one knows how long that will take. But we do know that, historically, high net worth investors are best served by riding out downturns and staying invested, remaining focused on long-term goals.
John Apruzzese is the Chief Investment Officer at Evercore Wealth Management. He can be contacted at apruzzese@evercore.com.
Howard Cure, partner and Director of Municipal Bond Research, writes about the remarkably bipartisan Infrastructure Investments and Jobs Act (IIJA).
The rollout of the IIJA will substantially impact state and local municipalities. Bond investors should pay close attention, especially to revenue system opportunities. Read more here.
Howard Cure is a Partner and the Director of Municipal Bond Research at Evercore Wealth Management. He can be contacted at cure@evercore.com.
Editor’s note: Evercore Wealth Management supplements its core investment capabilities with carefully selected outside funds across the range of the firm’s asset classes. Here we recap part of the April 7, 2022, webinar discussion with Joelle Kayden, the founder and managing member of Accolade Partners; Debra Netschert, a health sciences equity portfolio manager at Jennison Associates; and Evercore Wealth Management Partner and Portfolio Manager Judy Moses. Please note that the views of the external managers are their own and not necessarily those of Evercore Wealth Management.
Judy: Over the last two years, we have become much more focused on our personal and our families’ healthcare and the ways in which we interact with the healthcare system. How transformational a period is this?
Debra: There are two big issues happening in healthcare. First, the baby boomers are aging, which will increase the number of seniors needing healthcare. Second, we will have a huge demand for primary care physicians because the number of physicians coming out of medical school is diminishing. The estimates suggest that we will be short 50,000 primary care physicians in 5-10 years. The only practical way to solve that is to find ways to be able to provide care in a more efficient virtual setting.
We are already seeing changes. For example, telemedicine wasn’t really embraced by physicians and patients pre-COVID. People were hesitant to use it. Even if you had the telemedicine option through your insurance, people believed they wouldn’t get the best possible care that way. Now, it’s easy to understand the areas in which you can use telemedicine and the areas in which you can’t, and how this tool can improve the efficiency of the system. Telemedicine is here to stay.
Judy: The United States is often criticized for spending so much per capita on healthcare, and yet we don’t have the healthiest population. Why do you think that is?
Joelle: As the saying goes, “There is a trillion dollars of waste, we just don’t know where it is in the healthcare system.” I think it’s in a couple of places. The biggest is in administrative overhead. There are whole industries dealing with reimbursements – making sure that the right person gets paid the right amount of money, and the document is coded correctly and so on. This is nuts! It’s a multibillion-dollar industry. There is fraud, abuse, and waste in this system. There are also huge variations in practice patterns among physicians in different parts of the country.
We didn’t really have the data before to be able to do this, but instead of reimbursing on a fee-for-service basis, physicians are now being reimbursed for episodes of care. In other words, physicians are being held accountable for the whole treatment, not just delivering that one service. And they’re able to take risks, which means they can share in the savings against a rate that is largely established by the government, because commercial payers tend to follow whatever the government sets as the appropriate reimbursement.
You must have the data in the first place, to convince people that they can take risk and that they could achieve efficiencies in the system. This is a concept called value-based care, and it’s increasingly being adopted by more forward-leaning physician groups and companies that are venture backed. Hopefully it will reduce the utilization of the healthcare system and be used as needed, instead of generating a lot of unnecessary costs.
Judy: What are the areas within healthcare where innovation can be most impactful in improving efficiency, reducing costs and/or or improving health outcomes?
Debra: If you can provide nutrition and health coach services to someone who is prediabetic to bring their blood sugar down so that they never get diabetes, you will save the healthcare system a whole lot of money down the road. I think eventually we will get to the point to lower the cost curve further down the line.
Joelle: A lot of the costs in the healthcare system are consumed in a person’s last period of life, whether it’s six months or a year. These are incredibly expensive inpatient procedures, and none of us want to deny care to a dying or elderly family member.
The drugs we are delivering today, such as the immunotherapy treatments that are targeted to treat cancer, are very expensive. You must ask, who is going to get the care, how many people are going to get the care, and who will pay for it? Fundamentally, the United States is a society that prides itself on innovation, but these procedures and drugs are still very expensive. I think there will be a shift if we can achieve some efficiencies to start to deliver this next-generation technology of care.
Judy: We saw this big run up in the stock prices of biotech companies initially during the pandemic, but recently it’s been a challenging area to be an investor. Can you talk about the impact of these companies coming to market earlier in their life cycle, and what that really means for the industry and investors?
Debra: There’s been a tremendous amount of innovation in biotech, and I still believe that we are in a technological super-cycle when it comes to biotech. We have more information about biological systems than we’ve ever had, which gives us the ability to really understand biology at a much deeper level. A tremendous amount of money was put into the venture capital firms, which in turn invested in a lot of biotechnology companies. As more biotechnology companies were created, they were entering the public markets at an incredibly early stage.
For example, 10 years ago, investors would have needed a greater proof of concept. Then, a company that was moving to an IPO would have had solid Phase Two clinical data in 60 to 120 patients so we would be able to understand what that molecule was capable of. But over the past two years, companies coming to the market didn’t expect to have their first drug in a human clinical trial for four to five years. There was an oversupply in the public markets of very early-stage companies that investors wouldn’t know for 10 years if they really had a great technology.
Science and drug development is a series of tests. If you fall and skin your knee, you clean it up, you figure out what went wrong, and then you try the treatment again. And that process is just not something that the public markets are good at. As private investors, we expect it will take maybe two or three years to see the fruits of those labors.
Judy: We have seen a big mental health challenge in relation to the pandemic, specifically in young people. Can you talk about what you are seeing in those trends?
Debra: There has been a huge shift in perception of mental health, where it’s okay to say you have depression or anxiety and it’s okay for your child to have ADHD. People are now realizing that physical health is just as important as mental health. Sometimes one could argue that mental health is even more important. I think we are going to see people be more demanding that whole health is reimbursed. When you think of the average cost per person, it may not go down in the median term because we will start to reimburse for mental health, preventive health coaches, and physical therapy.
For further information or if you would like to watch the full video recording, please contact us at wealthmanagement@evercore.com.
After years of easy money, aggressive monetary tightening raises important questions for investors. What’s the best way to be positioned in such a challenging investment environment? And, more hopefully, what are the investment opportunities?
A focus on quality seems to us a reasonable response in these circumstances. Although high-quality companies also decline in turbulent markets, these companies generally have withstood the test of time by successfully enduring economic downturns and rebounding strongly once the economy and stock market eventually recover.
While there is no universally accepted definition of quality, we find that high-quality businesses can be identified in terms of five key attributes: high profitability, a sustainable competitive advantage, attractive long-term growth prospects, capable management teams, and strong balance sheets. In our view, these characteristics should enable such companies to achieve sustained investment performance over a full market cycle.
Let’s take a look at each of these components:
High Profitability: A defining characteristic of high-quality businesses is their ability to earn sustainably high returns on invested capital over time. (Return on invested capital measures the after-tax operating income of a business relative to the total capital employed in the business.) High-profit businesses, such as Apple, MasterCard, and Home Depot, can consistently earn strong returns on invested capital, exceeding the cost of capital demanded by shareholders and creditors. These rare businesses often possess pricing power or, alternatively, utilize their resources more efficiently to generate strong returns and strong, predictable cash flows.
Sustainable Competitive Advantage: A sustainable competitive advantage enables a business to earn higher compounded rates of return over time than its competitors. Primary sources of competitive advantage often include intangible assets such as brand names like Nike, intellectual property protected by patents or copyrights such as Walt Disney, or licensing and franchising agreements like McDonald’s. Other sources of competitive advantage include economies of scale or cost leadership (e.g., Amazon), products or services with high switching costs (such as Microsoft), industries with high barriers to entry (e.g., FedEx), and network effects where the business becomes increasingly valuable as the number of participants in the network increases.
Attractive Long-Term Growth Prospects: High-quality businesses also have significant opportunities to grow by increasing market share, expanding into new markets, or by introducing new products and services (as Alphabet has done with cloud computing services, artificial intelligence, and autonomous driving). In their widely acclaimed book on corporate valuation, McKinsey & Co. consultants found strong empirical evidence that long-term revenue growth – particularly organic revenue growth – is the most important driver of shareholder returns for companies with high returns on invested capital.2 Furthermore, they found that investments in research and development correspond powerfully with long-term shareholder returns.1 In other words, it is the ability to grow the business by reinvesting capital at high rates of return that drives the strong long-term compounding effects of high-quality companies.
Capable Management Teams: A business that exhibits several quality characteristics could nonetheless underperform if it is led by an ineffective management team. Ineffective management teams often destroy, rather than create, shareholder value through imprudent use of company resources or by diminishing the company’s competitive advantage through poor decision-making. Indications of strong management teams include candor in communicating business results, a clearly articulated business strategy, a demonstrated track record of success, a history of deploying capital effectively, and a strong commitment to shareholder interests, as evidenced by JP Morgan Chase, for example.
Strong Balance Sheets: Companies with strong balance sheets (i.e., low-to-moderate debt levels) have greater financial flexibility and can withstand economic downturns or external shocks better than firms with weaker balance sheets. Strong balance sheets are particularly important during periods of heightened market volatility. Companies with this attribute like Morgan Stanley can use their financial resources to increase dividends, repurchase shares at depressed prices or take advantage of attractive business opportunities.
What about valuations? One practical challenge of investing in high-quality businesses is that, as a group, they are often more expensive relative to lower-quality peers and the overall market because of their superior characteristics. Interestingly, financial economists have found that returns from quality stocks may be abnormally high on a risk-adjusted basis even after accounting for their more expensive valuations. A plausible explanation for this anomaly is that analysts and investors systematically underestimate the future returns of high-quality businesses relative to lower-quality firms.3
Although high-quality businesses can outperform despite higher valuations, investors should hesitate to overpay at the cost of reducing long-term compounding benefits. We believe a market downturn provides long-term investors with an opportunity to add to existing high-quality businesses at more attractive valuations. Furthermore, businesses with extended valuations or deteriorating fundamentals should be sold and replaced with higher-quality businesses with more compelling valuations and longer-term prospects.
Evercore Wealth Management strives to purchase shares of high-quality businesses at attractive valuations and hold them for the long term. As illustrated below, this approach has enabled our clients to benefit from the economic advantages of these stable businesses and capture their long-term compounding effects.
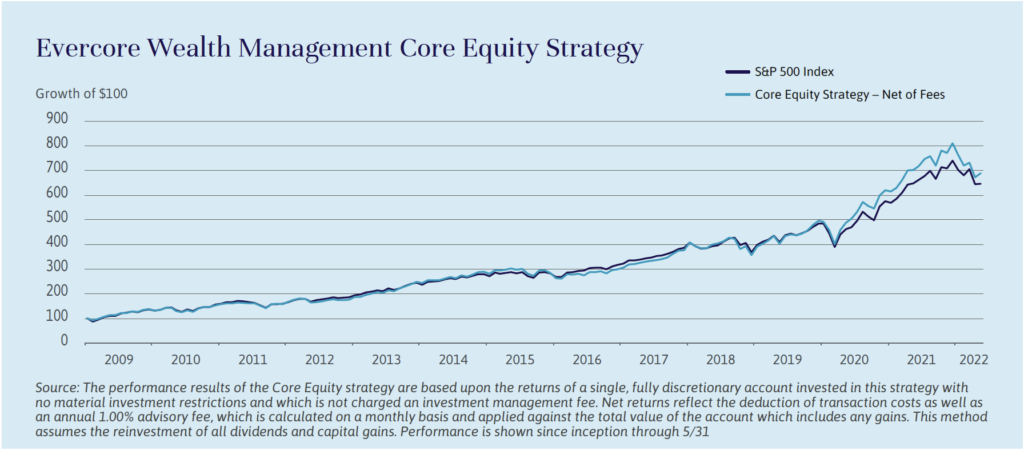
Aldo Palles is a Managing Director and Portfolio Manager at the Evercore Wealth Management office in Palm Beach, Florida. He can be contacted at aldo.palles@evercore.com.
It still isn’t easy being green. Some environmental and, for that matter, social and governance investing practices are under attack, as regulators and the financial press question the aggressive marketing of ethical principles to attract trillions of dollars in global capital. This scrutiny is long overdue and should ultimately benefit investors who hope to help create a better world. In the interim, current events are refining how individuals and institutions feel about ESG investing.
For example, inquiries regarding how ESG scoring integrates gun control skyrocketed after mass shootings, as one might expect, so much so that some large ESG investment solutions changed their methodology. More recently, however, many investors are reconsidering technology company exposures, hitherto the darlings of many ESG portfolios, over concerns about the risks associated with social media and the companies’ own governance issues.
The most dramatic changes in sentiment apply to U.S. domestic energy and defense contractors, two sectors that have traditionally scored very poorly on the screens of ESG data providers. But now the thinking goes something like this: Should a domestic natural gas producer sending liquefied natural gas to Europe now be considered socially responsible? What about a defense contractor that sells weapons to a country fending off an invasion? And should ESG scores for companies with high levels of exposure in revenues to countries run by autocratic or totalitarian dictators begin to negatively impact scoring?
There are many lenses by which to view ESG. With high inflation, driven by a combination of monetary and fiscal stimulus and myriad supply chain disruptions, as described by John Apruzzese in his article here, underlying changes are even – and controversially – taking place to the area historically viewed as the least ESG-friendly: the global fossil fuel and energy sector. Proponents note that some of the companies in this sector are leaders in building out renewable infrastructure, looking for and finding new and more sustainable forms of energy, and adding technology components to traditional energy production to improve the carbon footprint.
All of the energy markets have been significantly disrupted by the war in Ukraine, and as a result, much of the globe is reconfiguring its energy infrastructure. It has become clear that access to natural resources that are either domestically produced or produced by a trustworthy geopolitical partner is important. As a result, this reconfiguration is likely to take years, not months or quarters, as countries work to ensure a stable energy supply through a combination of fossil fuel and renewable power. This means tighter supplies, more energy scarcity, and likely higher prices for the foreseeable future. Renewable power sources are responsible for just 27% of the global electricity generation at the International Energy Agency’s last count in 2019, significant progress from 2011 when it represented only 20 percent. But even this tremendous growth has only served to keep fossil fuel usage stable, not shrink it at a global level. This may require continued investment in methods to transition to a cleaner economy alongside, not just at the expense of, the fossil fuel industry.

In the interim, the focus of governments everywhere is on getting reasonably priced energy to those that need it to heat their homes and offices, fuel their cars, plows, trains and planes, and power their factories and hospitals. This is likely to involve the use of traditional fossil fuels, natural gas, oil and perhaps even coal, which, while losing energy market share, unfortunately still remains the dominant fuel input in many countries and represents over 35% of global electricity generation.1
None of this is to say that fossil fuel or renewables are inherently bad or good investments. The fundamental quality of any investment is a function of both its future cash flows and the price paid for those cash flows. Many fossil fuels-focused investments did relatively poorly over the past decade, the result of investors’ expectations that cash flows would soon diminish. That’s changed, at least in the short term, with the realization that the horizon for change is receding.
Clearly, investors must use their judgment in determining if and how to balance the desire to participate in the eventual transition to a more sustainable global carbon footprint with the realities of the current energy needs of the global economy. ESG means very different things to different people, and that decision will be very personal. We remain focused on viewing ESG portfolios as investments first, building individual, fully customized portfolios to meet each client’s unique long-term financial and ESG goals.
Brian Pollak is a Partner and Portfolio Manager at Evercore Wealth Management. He can be contacted at brian.pollak@evercore.com.
It took just three months for COVID-19 to spread around the world, followed by supply chain shocks and now persistent inflation, a reminder of just how interconnected we all still are.
But globalization, in spirit and in practice, is in retreat and cracks are appearing throughout the U.S.-centric trade and finance system. In an increasingly resource constrained world, risks and opportunities for investors may need to be recalibrated.
Take a look at the chart below. Global trade took off in 1991, with the end of the Cold War. And it really got going after 2001, with China’s participation in the World Trade Organization, sparking years of growth that lifted millions of people throughout the developing world out of poverty. Global access to the natural resources previously locked behind the Iron Curtain – and to the huge labor and growing consumer markets in China – paid significant dividends, notably to multinational corporations. U.S. investors and Americans generally benefited from the world’s willingness to retain trade gains in U.S. dollar-based assets, allowing the United States to finance its ongoing trade deficit.
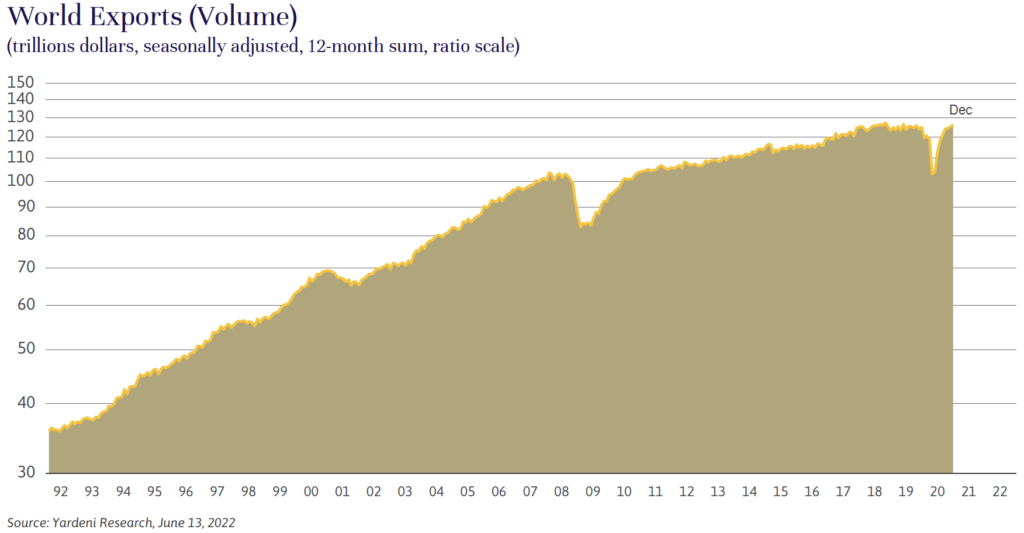
The United States and China effectively pressed rewind on globalization about five years ago, when the United States implemented stiff trade tariffs on Chinese goods and China became more autocratic and less capital-friendly.
And Russia has critically compounded fears of a new Cold War with the invasion of Ukraine. As of March 2022, global trade volumes are down 0.9% from the end of 2021, and growth projections continue to decline for 2022 estimates.
Now, U.S. companies are scrambling to onshore manufacturing or to at least diversify their sources away from China but are finding the effort neither easy nor inexpensive. Many tech companies, such as Google and Amazon, have pulled some of their businesses out of China, but at present, the United States remains dependent on both Chinese consumer goods and on semiconductors produced in Taiwan and South Korea.
China has stopped buying U.S. Treasuries. That’s been okay so far. As illustrated below, alternatives for global investors are limited and total demand for U.S. dollars is still high.
U.S. energy independence is good news, of course, but it does mean that the United States has less incentive to guarantee the security of international trade routes and stabilize the Middle East. Consider the trade disruption underway as Europe scrambles to reduce its dependence on Russian oil and gas, a difficult transition in the long term and almost impossible in the short term. The Persian Gulf countries produce 30% of the world’s oil, compared with Russia’s 10%, so the potential for trouble is that much greater.
Russia and Ukraine are also major exporters of wheat, vegetable oils and fertilizer, and the resulting shortages are exposing vulnerabilities around the world. Consumers everywhere are being hit with high prices for essential foods and, as always, the poorest are being hurt the most. Geopolitical alliances could shift in favor of China and Russia as governments in developing countries try to ward off starvation.
The high inflation rates that we and the rest of the world are now experiencing are a negative for almost all investment asset classes. Investors force values down as inflation mounts, not because the underlying assets are necessarily deteriorating, but to increase the future nominal expected return to make up for the higher inflation rates. Eventually, stocks should be an inflation hedge as well-managed companies adjust to the new reality, but that takes time.
It’s tempting to consider hedges. But attempting to invest in short-term inflation hedges can be a dangerous game. Commodity prices move up rapidly during an inflation shock, as they have recently, but the long-term returns from investing directly in commodities is very poor. Commodity producers present an opportunity, but timing is critical; most commodity producers are not good long-term investments because they tend to lack a competitive advantage. And Treasury inflation protection bonds, or TIPs, are not as helpful in combating inflation as one might think. They have generated a negative return this year through May 31 because real interest rates have moved up along with inflation, causing TIPs prices to fall. Only when real interest rates reach an acceptable level do they become a good inflation hedge. The real yield on the 10-year TIPs has only just turned positive, so we will be watching this market closely.
For investors, there’s a lot to think about. This is a good time to revisit both long-term goals and attitudes to risk, as Jeff Maurer discusses here, and to review capital market assumptions. Our balanced composite has experienced about an 11% drawdown so far this year.1 If we have a recession in the next 12 months, on which we are at present assigning a 40% probability, balanced accounts could drop another 10% or so as the stock market prices in falling earnings, in addition to the valuation reduction that we have already experienced. (See the article here addressing our focus on investing in high-quality companies.) The yields on longer-term bonds out 3-10 years are starting to get interesting but could go higher if inflation is not contained, so caution is warranted in this asset class as well.
Our primary focus at present is on wealth preservation, and we remain confident long-term investors. We continue to rebalance portfolios and reexamine risk tolerance, in the context of individual client goals and tax considerations. We are maintaining sizable allocations to defensive assets, as well as to illiquid investments, again as appropriate for each client. Finally, we continue to overweight the United States, as we have done for years, a position that has served many of our clients well. In this resource challenged environment, the United States is not immune, but we are relatively self-sufficient, in food and many other commodities, as well as in energy.
John Apruzzese is the Chief Investment Officer at Evercore Wealth Management. He can be contacted at apruzzese@evercore.com.
China’s pullback in new purchases of U.S. Treasuries is only the latest challenge to the U.S. dollar’s 60-year supremacy; others have included the formation of the European Monetary Union, the rise of Japan and China as global economic powers, and other changes to the international monetary system.
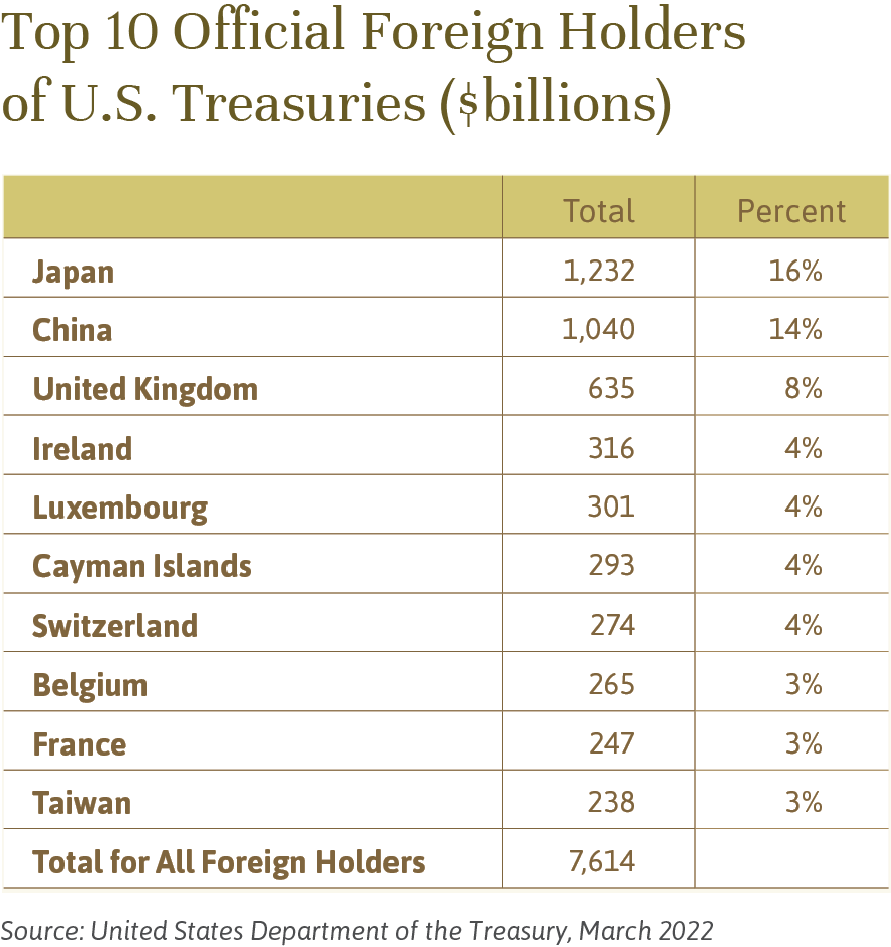
But the size of the U.S. economy, its importance in international trade, and the depth and openness of its financial markets have so far preserved the dollar’s status. It continues to serve as the world’s primary reserve currency, meaning countries around the world, as illustrated below, choose to hold large amounts of U.S. dollars for transactions, trade and monetary value preservation.
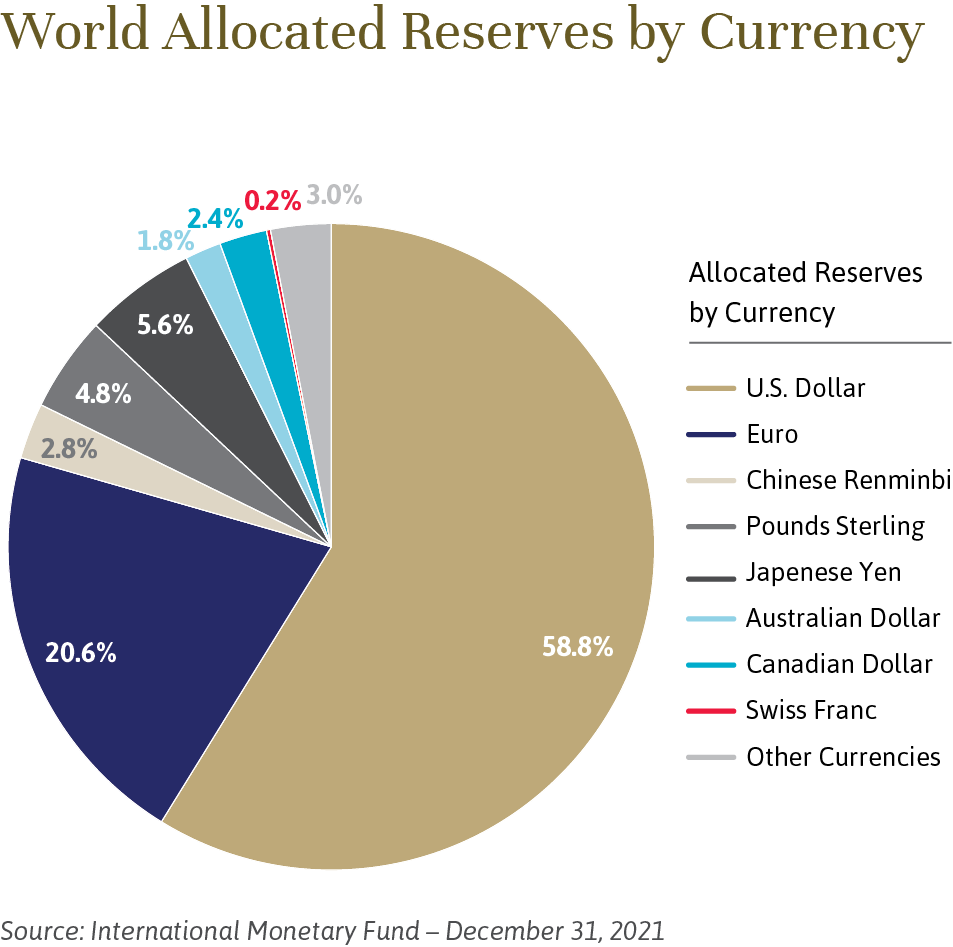
As John Apruzzese discusses above, this long-term global preference for U.S. dollars has benefited the United States in major ways, lowering the cost of capital for its government and corporations, and strengthening the purchasing power of its citizens. From Wall Street to Main Street, this is a big advantage and one of the reasons we remain overweight to the United States in our portfolios.
Editor’s note: Evercore Wealth Management supplements its core investment capabilities with carefully selected outside funds across the range of the firm’s asset classes. Here we discuss opportunities in self-storage with Benjamin S. Macfarland III, Chief Executive Officer and Co-Founder of SROA Capital, LLC (“SROA”). SROA is a leading, vertically integrated private equity real estate and technology platform that has an established track record of providing risk-adjusted returns to its capital partners through its focused strategy of investing in self-storage throughout the United States. Evercore Wealth Management recently invested in its most recent fund, SROA Capital Fund VIII. Please note that this article represents the views of SROA and not necessarily the views of Evercore Wealth Management.
Q: Self-storage has been a huge pandemic play for investors, with returns for the asset class outstripping real estate investment trusts and the broader market by a considerable margin. Why do you think that is – and do you worry that it’s going to change as the pandemic subsides?
A: The pandemic has generated a surge in storage demand as people were dislocated for periods of time and, in many cases, have changed the way they work and live. Whether it was college kids forced off campus, young professionals moving back in with their family, professionals clearing out an extra bedroom to create space for a home office, or investment managers moving their businesses and families to Miami, people from all sorts of backgrounds found themselves in a transition.
Storage is not a new concept. It has been around since the 70s and has become a widely accepted commodity. Today, storage is utilized by both businesses and individuals, with roughly one in 10 U.S. households renting a unit. For individuals, storage serves as a short-term solution during a life event or as a long-term extension of the home. Life events creating a need for storage can be positive (relocating for a new job or building a new home) or negative – something we call the “4 D’s” – death, divorce, downsizing, and dislocation. Positive life events have a strong positive correlation with the macroeconomy, while negative life events have a strong negative correlation, creating demand during both good times and bad. For small businesses, storage functions as a critical part of the supply chain. A contractor uses storage for equipment and materials, while the owner of an e-commerce business utilizes storage for order fulfillment. During prosperous times, businesses move from the garage to a storage facility, and during bad times, as we saw with COVID-19, businesses downsize from a light industrial warehouse to a storage facility. Storage has become an integral part of the economy as more and more Americans recognize its benefits.
One of storage’s most attractive traits from an investment perspective is its ability to generate consistent growing dividends that can be sustained through down cycles. This is a major reason why storage has outperformed other asset classes, and we expect this to continue.
Q: As you say, there are a lot of storage units out there, a lot of different companies. How do people decide which to use?
A: At SROA, we are a consumer-facing business. Every day we interact with consumers who rent space to solve a problem. When you think about storage, I think it’s analogous with an emergency room – you only need it when you need it, and you’re not going to spend a lot of time shopping around. And so, the location of a facility plays an important role when acquiring customers. In fact, of the roughly 80,000 unique tenants we have at SROA, close to 75% of them live within five miles of their unit.
Now, location is always an important factor, but you need to have other ways to attract new tenants. At SROA, we have built an operational technology platform overseen by an in-house digital marketing team that focuses solely on our marketing and digital web capabilities – things like search engine optimization (organic search) and search engine marketing (pay per click) – to develop targeted customer acquisition strategies for each market and property. We also have a 30-person customer call center that fields over 10,000 calls a month. Having this infrastructure in place is a critical component of our business, and its importance was highlighted more than ever by the onset of COVID-19. Pre-COVID, roughly 65% of our customer leads were generated through digital channels, be it from a Google search or paid advertisement; at peak-COVID levels, this figure jumped to over 90%. And today, this figure has settled down around 84%; we believe it will stay in this range.
Q: Self-storage is a highly fragmented asset class that is recognized for its strong performance during the COVID pandemic. How has the competitive landscape changed within the industry, and how do you see this industry consolidating?
A: Storage was one of the best performing asset classes during the pandemic and the best performing REIT sector during the great financial crisis. During the depths of COVID, our occupancy was flat year over year, rent collections were up, and we maintained our quarterly distributions, something we have never missed since I founded SROA in 2013. Given the strong performance of the asset classes during these periods, we have seen several new entrants into the space, but most are really only focused on acquiring large, brokered portfolios (>$500mm). This has had little to no effect on our business and, in the end, they have provided us with another exit option by deepening the institutional buyer pool for large portfolios.
A few other reasons we have seen little change to the competitive landscape include the size and fragmentation of the market and our focused roll-up strategy. First on the market, Public Storage is the largest player in the space with a market cap of ~$65 billion, and they only own 5.8% of the market, which means self-storage is a ~$1.1 trillion market. The top 100 operators only own ~29% of the market; the remainder is owned by non-institutional (or “mom and pop”) owners. We see this landscape evolving over the next five to ten years as these mom and pop owners approach retirement age and look to sell their assets. The largest group of these owners is the Baby Boomer generation who lack succession and estate planning. Let’s face it, storage is a not a sexy business, and more times than not the second generation would rather sell the business than assume operations. That’s where we come in. Our focus has always been on acquiring regional operators to expand our footprint into new markets and to then send our dedicated in-house acquisitions team into these new markets to acquire smaller independent storage operators. To date, this strategy has served us well, as 81% of our acquisitions have been sourced off market.
Q: What do you think about current market conditions, notably the increasing volatility and the prospect of inflation?
A: Volatility in markets creates opportunities, and we have been a direct beneficiary of the public market volatility created by COVID. The first acquisition in the SROA Capital Fund VIII was a 16-property portfolio in southern New England (Connecticut, Massachusetts, Rhode Island) that came about when a large public REIT was forced to drop the deal when their stock sold off ~30% in April of 2020. This was a portfolio that we had bid on but were ultimately outbid by the REIT. When we heard that the REIT had dropped the deal, we immediately called the seller and were able to negotiate the purchase on a direct basis without it ever going back to market. This portfolio has been the best performer in the fund. We have already acquired two additional properties in New England and are looking to expand our footprint in this region.
As for inflation, we welcome it and view it as a tailwind to our business, but we do not want to see hyperinflation. There are few asset classes better suited for an inflationary environment than storage, as all our tenants are on month-to-month leases, which allows us to raise rents with 30 days’ notice. People who are not familiar with the asset class often view these month-to-month leases as a liability, but our average length of stay is ~14 months, which is longer than multifamily and, more important, provides us with real pricing power to protect against inflation.
For further information on SROA and the other externally managed funds on the Evercore Wealth Management platform, please contact Partner and Portfolio Manager Stephanie Hackett at stephanie.hackett@evercore.com.
Illiquid alternatives is an umbrella term for different types of investment strategies that range from venture capital and private equity, to illiquid credit strategies, to investments in real estate and infrastructure projects. Many of the portfolios that we manage have a 5%-20% allocation to these illiquid assets, as these investments have the potential to generate strong returns relative to traditional asset classes.
An optimal allocation should have exposure to multiple strategies and diversification across vintage years, industry sectors, stages of investment and geography. In addition, illiquid portfolios can be structured so that maturing investment proceeds can be reinvested in similar strategies, allowing the pacing to become self-perpetuating. As with any investment, illiquid alternatives should be evaluated in the context of each qualified investor’s risk tolerance, liquidity needs and investment horizon.
Investors should consider adding illiquid assets to their portfolio that have the potential to provide diversification and alpha opportunities:
Illiquid alternative strategies can be attractive additions to a portfolio for qualified investors comfortable with a degree of complexity. They are long-term investments that may take a decade or more to return capital. The fee structures are generally higher than for stocks or bonds, and the timing of capital calls and distributions is unpredictable. Illiquid alternative investments also often have more complicated tax filing and require extensions. Investors rightly expect a premium return to compensate for this lack of liquidity, such as the potential to outperform public markets by at least 300-500 basis points, along with portfolio diversification.
Even investors who are older should consider illiquid investments, as they can be a valuable tool in estate planning. For other investors with compressed timelines or other constraints, illiquid alternatives may not be suitable. But for many high net worth investors, foundations and endowments, these investments offer the prospect of enhanced returns and diversification.
Stephanie Hackett is a Partner and Portfolio Manager at Evercore Wealth Management. She can be contacted at stephanie.hackett@evercore.com.
Kidney disease forecasting, drywall hanging, pizza delivery and crop management: These are just a few examples of activities being transformed through technology. The digital economy (ecommerce, software, tech hardware and so on) now represents more than 10% of the U.S. economy.
And there’s more to come. More than half of corporate capital expenditure, or CapEx, is now being invested in productivity-enhancing investments like cloud technology, artificial intelligence and vision technology, as well as robotics and the like. The $700 billion projected to be spent globally over the next decade building cutting-edge software for the cloud may herald exponential growth in related data applications, such as autonomous vehicles and automated manufacturing. At the same time, the investment payoff timeline is accelerating. Investments in robotics, for example, now pay off in half the time that they did 10 years ago.
The technology companies are both the beneficiaries and drivers of these trends, as John Apruzzese observes in his article, Powering Up: Technology Continues to Drive the Markets. Amazon spent more on CapEx in the past two years than it did in the previous 20, and Microsoft is working with thousands of organizations around the world to grow and combine their physical and digital worlds, and to explore collaboration opportunities in the metaverse.
A few other examples of current new economy investments in general, and digital investments in particular, by companies in the Evercore Wealth Management core portfolio holding include:
As these and other corporations continue to invest in improving their productivity, economy-wide productivity should also increase.
Michael Kirkbride is a Managing Director and Portfolio Manager at Evercore Wealth Management. He can be contacted at michael.kirkbride@evercore.com.
American technology companies have powered the market gains of the past five years and the astonishing 48% surge in the S&P 500 from pre-pandemic highs. The sector’s four biggest constituents (Apple, Microsoft, Amazon, and Alphabet, the parent of Google) now generate average annualized profit margins of 25% and account for 21% of the S&P 500‘s market capitalization. Their ability to consistently maintain these extraordinarily high margins ranks them among the most successful companies in the 200-year history of limited liability corporations. No other country has anything to rival them.
Now what? The recent market correction could be attributed to a growing recognition among investors that valuations, while not at record levels overall, need to come down in the face of higher inflation and prospectively higher interest rates. Or it could signal that future earnings may come in significantly below the consensus projection of 9% growth rate for this year and 10% for next year.
Either way, revenues are not likely to disappoint, assuming the pandemic ebbs and fairly high nominal economic growth continues. But can the technology giants, and by extension, the S&P 500, continue to generate record-high profit margins in the face of increasing costs? There are good reasons to think so, at least until we see evidence to the contrary.
First, the economy-wide investment in software, computer equipment, and research and development is growing at a rapid pace relative to GDP. As described in Investing in a Digital Future By Michael Kirkbride, we believe this growth rate will continue or increase. Companies are searching for ways to replace labor with technology.
Of course, some companies and entire sectors will be able to make this shift more easily than others. We are constantly on the lookout for the technology companies providing the best solutions, and for the companies in other sectors most likely to benefit from implementing that technology. One of the best examples of broad-based productivity enhancement through technology is the transition of most business software applications to the cloud. The major cloud providers, such as Amazon and Microsoft, are able to significantly reduce the cost of running essential business software for non-tech companies, as well as allow new companies with disruptive ideas, like Uber and Netflix, to scale quickly and easily. As remarkable as it seems, given all the technological changes of the past decade, we are still in the early stages of businesses moving to the cloud.
Second, many of the companies implementing technology into their businesses will themselves be able to increase productivity at a fast enough pace to offset current wage price increases. Those facing rapidly increasing labor costs are particularly incentivized to replace labor with software-driven technology if possible, a self-reinforcing virtual circle, at least from a profitability viewpoint.
Third, technology companies are also increasing their own rates of productivity, providing increasingly more powerful products and services at lower prices per unit of utility. Software companies are unlikely to suffer from the current spike in wage inflation. While great software engineers don’t come cheap and there is a shortage of programmers in this country, that could soon change if related visa restrictions are eased; otherwise these jobs will move offshore.
Indeed, it could be argued that the profit margins of software companies are understated, because their biggest current expense – paying coders to write new software – represents their biggest investment in the future. Established software companies have very little need to reinvest profits in traditional capital investments to drive future growth, so they are free to use their profits for dividends or share buybacks.
Most other sectors have healthy margins, notably pharmaceuticals, but not at anything like the tech industry levels – and they require the reinvestment of over half their profits to grow. The productivity of software companies as measured by revenue and earnings per employee remains unrivaled, and that productivity grows as software gets written on top of established programs. In addition, the application of the software a company sells enhances the productivity of the purchaser.
Fourth, we think the large tech companies will manage to maintain their high profit margins and that the implementation of software by companies in other sectors will reduce the risk of a wage-price spiral. One caveat: The large software companies currently pay very little to no corporate taxes because they are able to move their most valuable assets – the licenses on the programs – to tax havens. Although it’s easier said than done, the United States and other major countries would like to see the giant tech companies pay more tax. There is also rising political pressure to rein in these companies through increased regulations and antitrust legislation, which we will be monitoring.
So, there are some good reasons to remain positive about the technology sector in particular and the United States in general. However, we are mindful that our clients have enjoyed high returns over the past decade from their large-cap technology investments. We continue to hold significant positions in these companies but remain careful to rebalance portfolios as appropriate, taking profits and reinvesting in companies likely to benefit as the economy fully reopens – and technological advancement and adaptation powers on.
John Apruzzese is the Chief Investment Officer at Evercore Wealth Management. He can be contacted at apruzzese@evercore.com.
History, said (maybe) Mark Twain, doesn’t repeat itself, but it often rhymes. Investors may hear echoes of the past in the events unfolding in the Ukraine and in the rising tension between China and the United States, but it would be a mistake to draw narrow parallels. That’s true too for this and earlier periods of inflation.
The Consumer Price Index, or CPI, is 7.5%, its highest rate in 40 years, a shocking change after two decades at under two percent. And potentially sustained higher prices for global commodities, notably oil and wheat, in the wake of the Russian invasion of the Ukraine, won’t help. Some observers are understandably anxious that this could signal the start of another period like 1973-1981, when inflation averaged about 9.25% and real GDP growth was modest, a combination known as stagflation. But today’s situation is different on three major counts: productivity, demographics, and the relationships between wages and prices.
The nine years starting in 1973 marked the lowest productivity rates post-WWII, generating just 1.1% labor force productivity growth, or half the rate for the full period, as illustrated in the chart below.
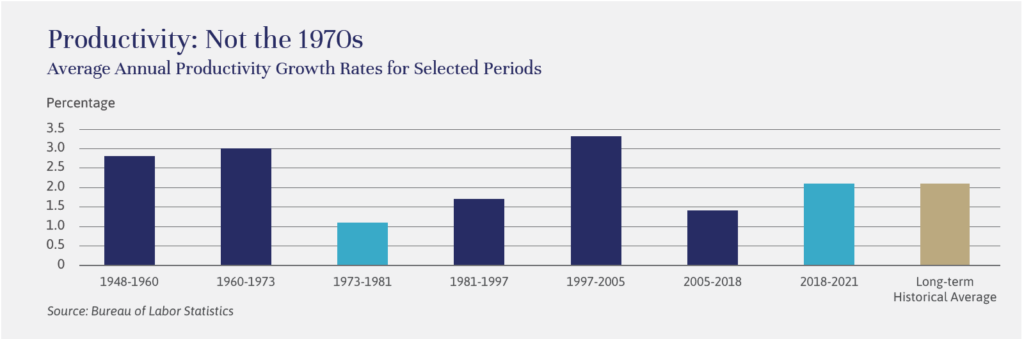
Today, there are reasons to think that the recent uptick in productivity in the last two years could usher in a period of still higher (above 2%) productivity growth. In addition, capital spending (CapEx) is robust, with expenditures increasingly focused on technological advancements and significant productivity-enhancing technology. We can see this through the growth in robotic installations across all industries, which has been steadily growing in the last decade, and the percentage of overall CapEx that is focused on new technology. While we may not see a 50s-, 60s- or late 90s-style productivity boom, recent CapEx trends and technological advancements should drive productivity to at least the long-term average of above two percent. Strong productivity growth perhaps makes the best case for why stagflation is less likely moving forward.
While the Millennial generation is almost as large as that of their Baby Boomer parents, they aren’t forming households and having babies at anything like the same rate. Indeed, there were nearly seven million fewer households formed in the decade of the 2010s than in the decade of the 1970s, despite a population base that was nearly 40% smaller. With fewer new households being formed, it is no wonder that the number of births and deaths in 2021 was roughly the same. COVID-19 contributed to the deaths, but the low birth rate did far more to change the equation. (See the chart below.) With birth rates so low, U.S. population growth will depend solely on net immigration, a trend that has also recently been moving in a negative direction.
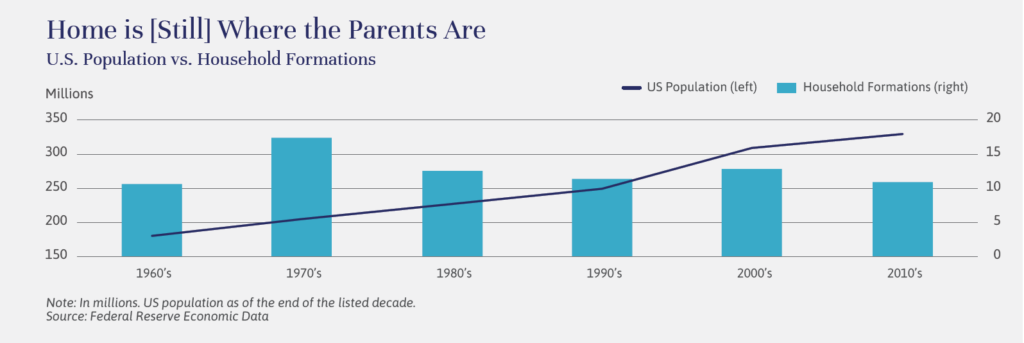

At the same time, Baby Boomers are retiring at a high rate (the youngest Boomers are now in their late 50s). As retirees generally consume less than those in the labor force, and households with babies generally consume more than those without children, it seems that downward pressure on demand will serve to also dampen inflation for some time to come. It’s also worth noting that even though Boomers are retiring, the average age of the labor force continues to increase, another potential argument for long-term high productivity and low inflation.
In the 1970s, unionization was broad-based in the private sector, representing between 25%-30% of the private sector work force through most of the decade – down from its peak in the 1950s but a powerful force nonetheless, as illustrated below. Many of the unionized private sector labor contracts in the 1970s (as high as 59% in 1970) were subject to cost-of living adjustments, or COLAs, meaning that many union wages were tied directly to inflation. A manufacturer of the day, having its primary expense (labor) tied directly to inflation, and with little advancement in productivity to offset those higher costs, would have no choice but to increase the price of products to keep margins at least somewhat intact. Higher prices passed through to the consumer would again impact the calculated rate of inflation in the labor contracts, causing further wage increases.
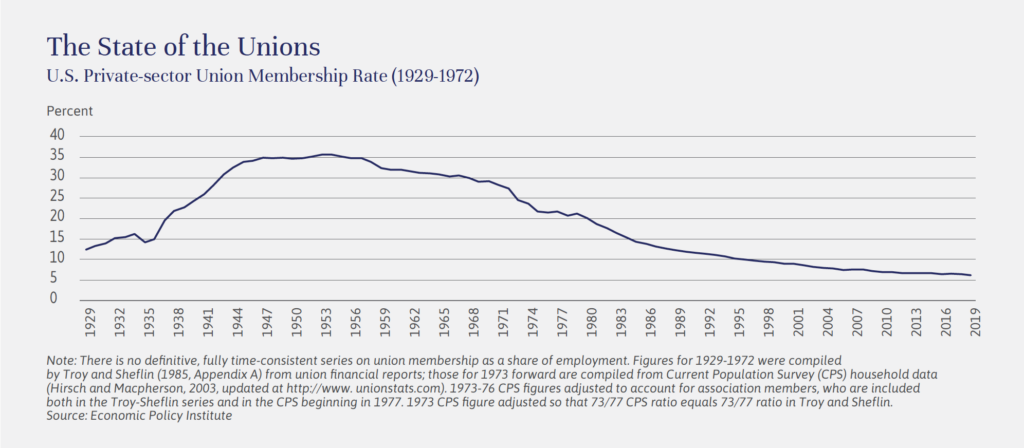
Today, with only 6% of the private sector labor force unionized, and a very small percentage of that group with wages tied to COLAs, a 70s style wage-price spiral is quite unlikely, even if wages continue to rise.
During the 1970s, Baby Boomers were pouring into the labor force, causing an oversupply of labor, which theoretically should have driven the price of labor down. But because of the combination of high unionization rates and high rates of COLAs in collective bargaining agreements, labor costs continued to rise. The abundant supply of workers also made it easy for corporations to hire new workers as needed, and corporations in aggregate did not make significant technology-driven capital investment to reduce their labor costs and improve productivity.
Today, there is a real labor supply problem. In 2021, wages rose 5.7%, with lower-wage workers experiencing a higher wage increase than higher-wage workers. Although they did not quite keep up with the high rate of inflation, further increases are expected in 2022. Can corporate margins keep pace with these wage increases? As John Apruzzese discusses in his article, Powering Up: Technology Continues to Drive the Markets, productivity will determine the answer. If wages increase by 4% and productivity increases by 2%, the unit labor costs will be increasing by 2%, a manageable scenario for most companies and a healthy increase in wages for most employees.
While there are many other factors that could impact the economy and the inflation backdrop, and we are certainly maintaining vigilance in portfolios to protect against worst-case outcomes, we don’t think the current period will repeat, or even rhyme with, the 1970s. Perhaps the post-World War II bout of inflation, between 1946 and 1948, is more analogous. Then, as now, there was significant suppressed demand and supply chain disruptions, and then a sudden spike in consumer demand, which caused inflation to surge to 20% in July 1947. Inflation, as illustrated below, then quickly dissipated, and a period of disinflation set in.
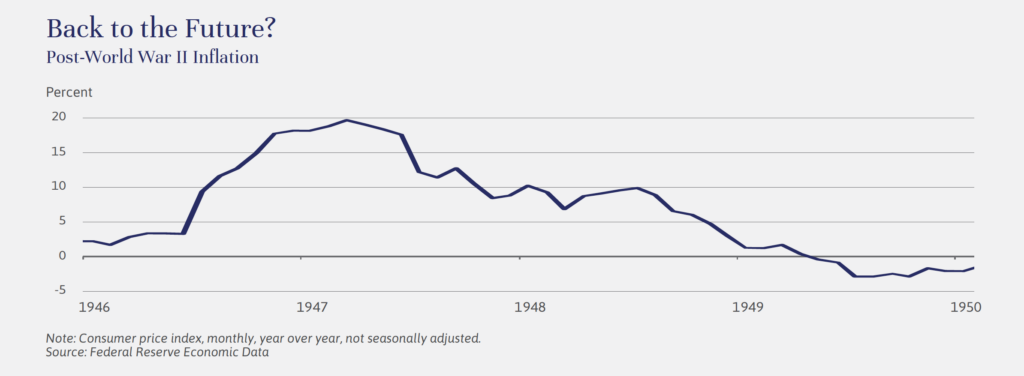
We are living in interesting times, with echoes of the past but also important new influences. For now, we are comfortable with our current asset allocation and remain confident in the continued strength of corporate earnings and real GDP growth. We will be watching for potential new risks and opportunities, including in Europe, where we all hope for better days soon.
Brian Pollak is a Partner and Portfolio Manager at Evercore Wealth Management. He can be contacted at brian.pollak@evercore.com.
Editor’s note: This article is extracted and updated from “Another Governor for New York: The Muni Outlook,” also by Howard Cure, published by Evercore Wealth Management in August 2021. For bondholders, the transition of power in both New York State and New York City shouldn’t be much cause for concern. Kathy Hochul, who replaced Andrew Cuomo as Governor, is the former Lieutenant Governor. Eric Adams, the presumptive next Mayor of New York City, has significant state and local government experience as well as serving, with distinction, as a NYC police officer.
Both face big challenges, however. Staffing, managing all the issues associated with the coronavirus pandemic, infrastructure spending, and running for office will likely be top of mind for Ms. Hochul. Mr. Adams hopes to improve relations between the city and state, and revive the city’s economy while providing opportunities for all people to share in the growth.
The Metropolitan Transportation Authority, or MTA, is among the most pressing issues. The MTA has lost about half of its riders since the pandemic started; emergency federal aid has bolstered the authority against a huge operating deficit. However, budget gaps are on the horizon, as soon as 2025. Fortunately, the state is providing increased financial resources for both operations and capital expenditures.
On a related note, implementing congestion pricing in New York City, which is expected to generate $1 billion a year, is also a challenge. The revenue from congestion pricing – a charge on driving in certain traffic-prone areas – was meant to help fund the MTA’s $51 billion, five-year capital program. Congestion pricing needs to reasonably maximize revenues while determining possible exemptions to the fee. It remains to be seen if capital priorities will change under a new administration.
The relationship between Mr. Cuomo and outgoing New York City Mayor Bill DeBlasio always seemed particularly adversarial, even by New York standards. The city needs state approval for most tax reforms or implementing important programmatic changes, and a constructive relationship between Ms. Hochul and Mr. Adams could result in real benefits.
New York State and New York City have proven their resiliency time and again. A transition to a new leadership, while challenging, does not diminish our confidence in the state’s or city’s credits.
In New York, as with all of our state and local bonds, we continue to focus on credit issues that have a broad revenue base and strong legal pledge, such as New York State general obligation, personal income tax and sales tax bonds, as well as essential purpose revenue systems such as water, sewer and public power issues. At the same time, we are more cautious and selective when it comes to sectors more severely impeded by the pandemic, such as transportation bonds and the healthcare sector.
Howard Cure is a Partner at Evercore Wealth Management and the Director of Municipal Bond Research. He can be contacted at cure@evercore.com.
Is ESG investing fueling inflation? As counterintuitive as it seems, the well-intentioned allocation of capital may come at a cost to investors. That’s particularly true in the energy sector. Environmental, social and governance, or ESG, investing has grown very quickly into a mainstream and increasingly dominant force in portfolios, reflecting growing concerns among investors across a range of issues from boardroom diversity to carbon footprint.
Let’s back up. This style of investing is designed to combine capital growth with long-term business and environmental sustainability. Estimates vary widely, but it seems fair to say that the 40%-plus growth over the last few years that has led to $17 trillion1 in sustainably invested assets is poised to continue apace.
Countries and corporations are paying attention. At present, 90% of S&P 500 corporations publish a sustainability report, up from 20% in 2011, indicative of both investor and management focus.2 Among the topics addressed are direct impacts like energy companies transitioning from reliance on fossil fuels, in response to investor and regulatory pressures, as well as corporate commitments to sustainability.
As a result, traditional energy production is becoming more difficult and more expensive. Oil production growth rates are falling and coal use is dwindling.
So far, so great for ESG investors. But energy transitions take time. Coal, oil and natural gas all took decades to move to peak usage. While some renewables, notably solar and wind, are now within striking distances of rivaling traditional energy sources in cost effectiveness at scale, there are still some big issues to be resolved, such as those around storage and transmission. Overall, the use of modern renewables is barely a decade along in its growth. At the same time, global demand for energy is rising. The International Energy Agency projects global energy demand to increase by more than 2% per year for the coming decade and, in the recovery from the pandemic shutdowns, almost double that rate in 2021.
As Bill Gates describes in his book How to Avoid a Climate Crisis, the move to modern renewables is, at this time, based on environmental interests and often in the face of economic interests. A possible result is inflation and the economic pressures that go along with it. As a case in point, rising prices across most of the energy sector are contributing to increases in gasoline prices to multiyear highs, putting pressure on consumers, as illustrated by the chart below. While these price hikes may indeed prove transitory, they also serve as a reminder of the importance of considering longer-term supply-demand dynamics.
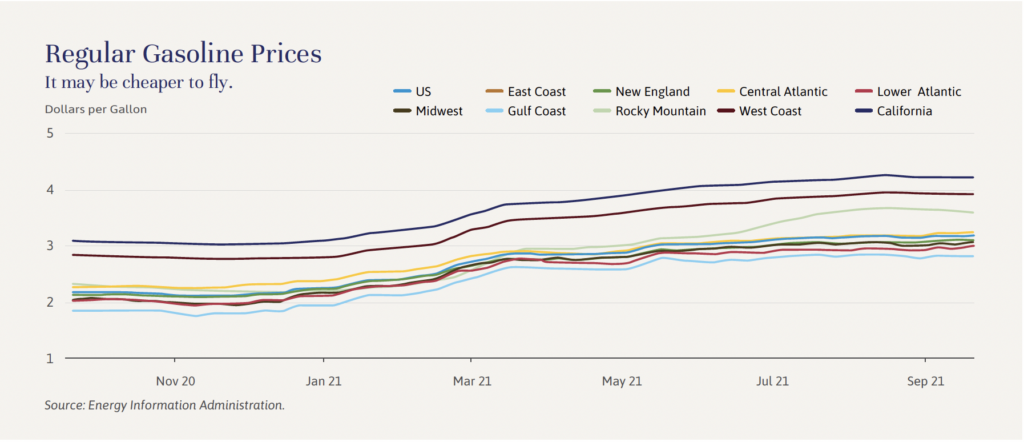
What would be the offset to this inflation? As with so many other aspects of the economy, we look to technology-driven productivity gains and the companies leading that charge. The 2020 pledge by Google parent Alphabet to carbon-free targets by 2030 was big news. Two other examples from the current Evercore Wealth Management core equity portfolio also serve as good examples of corporate change: BorgWarner, a traditional auto parts supplier, is evolving into an electric vehicle/hybrid supplier; and Microsoft’s Azure cloud segment has built a suite of software designed to drive efficiencies and safety throughout the energy industry.
Investors will be wise to monitor the extent of this green premium. Future inflationary trends and the transition to a greener future are important considerations in building portfolios meant to last.
Michael Kirkbride is a Managing Director and Portfolio Manager at Evercore Wealth Management. He can be contacted at michael.kirkbride@evercore.com.
Properly diversified investment portfolios are naturally hedged against inflation. Short-term bonds, equities and real estate can be surprisingly strong defenses against rising inflation; assets commonly perceived as targeted inflation hedges, not so much. It’s a distinction worth thinking about in asset allocation, even in periods of transitory inflation.
Let’s start with fixed income. Bonds with long-term fixed interest rates, especially those with 10 years or more to final maturity, are no one’s idea of strong performers when inflation is relatively high, as it is now at 5.3%, after averaging just 1.9% over the previous decade. While inflation doesn’t present a risk to the principal value of bonds (assuming the issuers don’t default on their obligations), it can certainly erode the purchasing power of their proceeds. At present, the 10-year Treasury note has a nominal yield of just 1.52%, well under the 2.38% inflation rate widely anticipated in the market over the same period.
In contrast, high-quality municipal and corporate fixed rate bonds with shorter-term maturities are relatively stable in periods of high inflation, at least relative to longer-term maturity bonds. Additionally, investors are able to reinvest proceeds more quickly, to take advantage of higher yields.
Floating rate securities, which carry variable coupons that change based on a benchmark rate, usually tied to short-term interest rates, are also relatively appealing when inflation and interest rates are rising. Many higher-yielding corporate securities, such as bank loans and middle market loans, are offered at floating rates, and provide attractive current cash flows that could rise if inflation persists. (See the chart below for current fixed income returns.)
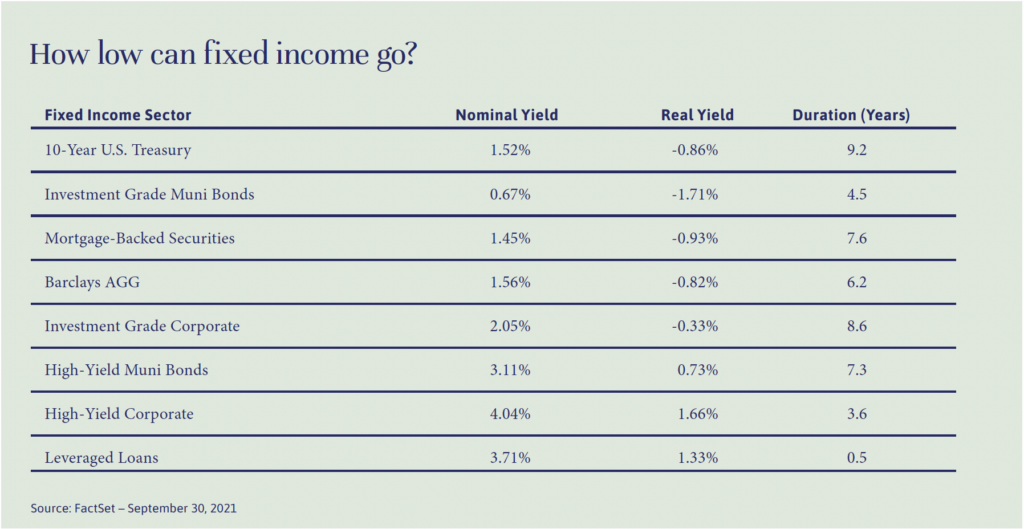
Treasury Inflation Protected Securities, or TIPS, are commonly misunderstood as effective inflation hedges. TIPS were created by the U.S. Treasury Department in the 1990s in an effort to provide investors with a way to protect their Treasury investments from inflation. Principal and interest payments are indexed to the Consumer Price Index, or CPI, providing investors with some protection from a decline in the purchasing power of their money. But the prices of TIPS are also dependent on the prevailing market real interest rate (the yield less expected inflation over the life of the security).
Currently, the real interest rate for a 10-year TIPS is -0.89%, meaning that a TIPS investor effectively pays a premium to invest in a bond with no coupon. In an inflationary environment, investing in TIPS will provide a rate of return less than that of expected future inflation. If the real yield increases, the price of the TIPS declines, as bond yields move inversely to price, further diminishing the TIPS’ total return. Indeed, TIPS can generate negative returns even if inflation is rising.
What about commodities? Investors may still associate precious metals generally, and gold in particular, as beneficiaries of inflation. But gold now appears to be most correlated to changes in real interest rates, rising as real interest rates – and the returns of conventional investments such as cash equivalents and bonds – fall. Gold prices are therefore unlikely to perform well in an environment where the Federal Reserve starts to aggressively increase interest rates to fight accelerating inflation. There may be other reasons to own gold within an investment portfolio, but it’s likely not an effective inflation hedge.
Commodities overall often perform well as an asset class during inflationary periods, as prices generally rise rapidly with demand. But they can fall just as fast when supply catches up and/or other inputs become a factor, such as rising costs, regulation and technologically driven productivity gains. There are interesting developments in some areas of the market (see the article by Michael Kirkbride on page 6 on the impact of ESG investing on the energy sector), but we believe that commodities in general do not constitute an attractive asset class for long-term investors.
While spot commodity prices typically do well during periods of inflation, they generally do poorly in other environments, such as in low or stable inflation or deflation. In addition, the spot prices are not investible, forcing commodity investors into vehicles that purchase futures. The Commodity Futures Index has had a 0% cumulative return over the past 30 years (as illustrated by the dark blue line in the commodity chart below).

Equities, in contrast, have a good chance of performing well through periods of high inflation, although investors may need to be patient for a couple of reasons. The first reason is that companies may initially struggle to increase revenues at a rate high enough to offset input cost inflation while maintaining profit margins, creating temporary equity market volatility. We’ve seen this in the utility sector, for example, where regulatory constraints make quick repricing difficult. The second reason is that long-term investors tend to discount the value of future cash flows more steeply during periods of high inflation, forcing the multiple on future earnings down overall, and a shift to companies with relatively certain near-term cash flow and earnings power, and away from growth companies. But again, this move in the market is likely to prove temporary. Eventually, we expect companies with persistently high earnings growth to outgrow the rate of inflation.
It’s important to note that price dispersion among companies during inflationary periods may increase, as those better or more quickly able to pass through costs to end consumers will be at an advantage, and shares in some could even be considered inflation hedges. Commodity producers, consumer staples companies and financial services companies should be able to raise prices quickly as inflation rises, offering inflation protection. Conversely, companies with fixed prices that are difficult to change or tied to inputs other than inflation will likely underperform. Companies with high dividend yields, but limited revenue growth, may also be susceptible to rising inflation, as the value of the dividend cash flow to investors diminishes.
Private equity and venture capital investments have similar characteristics to their public counterparts in an inflationary period. The underlying economics are the same, in that private companies with pricing power will be able to manage increasing input costs. However, private companies are not marked to market as quickly as public companies, so the initial drops in value due to reduced valuation metrics are not as obvious and may be overcome for private companies that are able to quickly adjust to the inflation of their input costs. Over the long term, we continue to expect private investment returns to outstrip their public counterparts, due to the illiquidity premium, which is driven by managements’ longer-term outlook and higher levels of low-cost leverage.
Investors able and willing to accept illiquidity may find that prudently leveraged private real estate, with its solid current cash flows and the potential to grow cash flow through increasing net operating income, is one of the best hedges against inflation. In general, private real estate generates cash flows at a rate higher than traditional fixed income, and those cash flows can grow over time, in some cases at a rate tied to the Consumer Price Index. Real estate is a hard asset with intrinsic value that can also appreciate in value, protecting the purchasing power of the investment.
Yes, many real estate submarkets look expensive at present. But there is some natural land scarcity in many regions, and the value of any existing real estate in those locations will be tied to the cost to replace a similar structure, which should also be rising during periods of inflation. Private real estate is often purchased using leverage – and leverage, especially the fixed rate variety, can significantly enhance the investment performance of an asset during inflationary periods, as the value of the principal and fixed interest costs are diminished by broadly rising prices. Unlike commodities, real estate has the potential added benefit of having a positive expected return in a low inflation environment, if the cash flows provide a floor to expected returns.
Bitcoin and digital assets are uncorrelated to inflation, although they may provide an inflation hedge to the extent that they provide diversification from assets that could be impacted by inflation. Our approach in this area is through venture capital investments focused on digital assets and related businesses, as appropriate for individual clients.
It may take time, but the market and the Federal Reserve appear to believe that inflation will moderate from its current high level, as supply chain issues ease and volatility in commodity prices abates. Jay Powell, the Fed Chair, had this to say during a recent speech at the annual Jackson Hole conference: “While the underlying global disinflationary factors are likely to evolve over time, there is little reason to think that they have suddenly reversed or abated. It seems more likely that they will continue to weigh on inflation as the pandemic passes into history.”
We agree. But as stewards of family and institutional capital, we remain alert. We believe broad diversification can help protect portfolios from all manner of long-term risks, including the potential for sustained high inflation, if and when it comes.
John Apruzzese is the Chief Investment Officer at Evecore Wealth Management. He can be contacted at apruzzese@evercore.com.
Brian Pollak is a Partner and Portfolio Manager. He can be contacted at brian.pollak@evercore.com.
Editor’s note: This article is extracted from a recently published paper. Click here to read the paper in full.
There are as many opinions about the future of New York City as there are New Yorkers. The city, which was the early U.S. epicenter of the pandemic, is now the focus of discussions around the future of urban life.
Some have voted with their feet; others are certain that the city’s best days are ahead. From a fiscal point of view, the future of the largest municipality in the United States matters to investors well beyond the five boroughs. The key will be to distinguish between short-term disruptions and lasting change.
While full out-migration patterns to date are in line with previous moves, there is still potential for a permanent – and negative – shift. The trend to remote work has coincided with improved communications technology and a significant demographic shift as two giant population groups, Millennials and older Baby Boomers, transition to family and retirement life, respectively, and from the costs and other stressors of high-density living.
In addition to migration out of the city, and the considerable related existing and potential revenue implications, the city’s fiscal health will represent a big challenge for the next mayor (who will be elected in November). So too will public safety and the new awareness in all quarters of the city of the need for a more inclusive and equitable economic recovery. It is our view that New York City will remain a global center for finance, education, healthcare, technology and culture, but not without changes to its prior established position. Investment exposures should be allocated and managed accordingly.
Spreads, or the difference in bond yield between the issued debt and gilt-edged AAA-rated debt, are starting to reflect the city’s improving economy, thanks to the implementation of federal programs and effective vaccine distribution (see the chart below). Still, most spreads are wider now than pre-pandemic levels at the end of 2019, which means there are still selective buying opportunities, assuming the economy continues to recover. We will continue to monitor the pace of the economic recovery and the spreads on these New York credits to determine buying opportunities.

Howard Cure is a Partner and the Director of Municipal Bond Research at Evercore Wealth Management. He can be contacted at cure@evercore.com.
Investors who care about sustainable investing often care very deeply, as a way to express their individual values and drive change. For something so personal, there can be no one right approach, no single lens. Portfolios should reflect the interests of the people they serve – and ideally at no cost to performance.
On the surface, it seems as if any and every interest can be expressed in this marketplace. There are now about 400 so-called sustainable mutual funds and exchange traded funds, or ETFs, in the United States alone, up fourfold in just over 10 years (see chart below).1
In 2020 alone, over $50 billion in net capital flowed into these investment vehicles. And these numbers appear likely to grow. The Federal Reserve and the Biden Administration have stated explicitly that climate change and a transition to a more sustainable economy are important economic policy tenets. Corporate boards and CEOs are not far behind, with increasingly frequent references to corporate ESG policies and disclosures. And many large investors, notably BlackRock, the world’s largest asset management firm, are pressuring investors and corporations alike to make a more significant commitment to advancing ESG concerns.
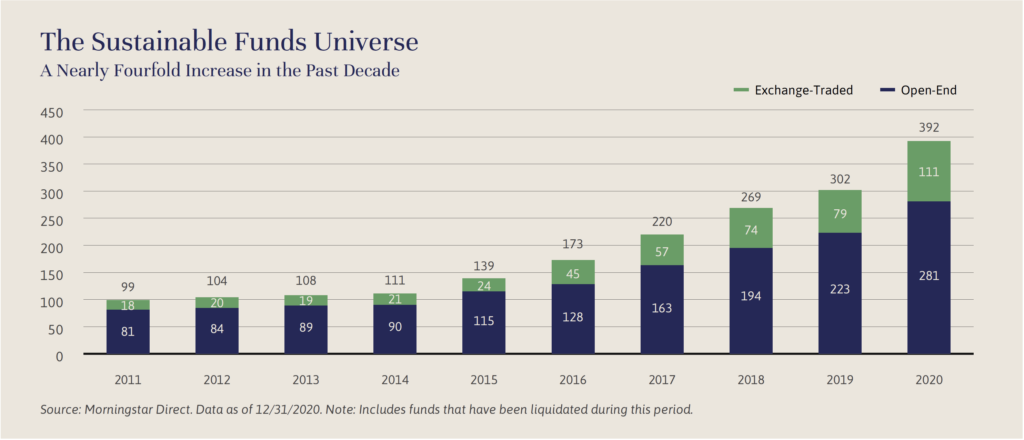
But choice can, as any consumer knows, breed confusion. Portfolios and the indices they benchmark against are often tilted toward certain environmental, social and governance, or ESG, factors, such as avoiding exposure to high levels of carbon emissions or the use of child labor, and tilting exposure toward board or C-suite diversity or good corporate governance. While the approaches afford investors more opportunity for customization, the individual E, S and G elements can be perceived differently and don’t necessarily work well together in evaluating exposures. (See the box at the end of this article for a guide to these terms.) Focusing on broad ESG indices as benchmarks can also cause investors to lose sight of the whole and lead to surprising outcomes, such as the inclusion of oil producers or handgun manufacturers in so-called sustainable funds or other unanticipated exposures.
Consider Facebook, Inc., which for several reasons is not a priority holding in our core equity strategy, but is often referenced by other investors as an ESG-friendly holding. According to data from Refinitiv Financial Solutions, Facebook’s overall ESG score is a B- as of this writing, with an A grade in resource usage mitigating lower grades in governance and social pillars. But when data around privacy and competition controversies are factored in, Facebook’s combined score falls all the way to C-. These controversies are not factored into the traditional ESG scoring methodology, but their presence creates valid potential risks to the company’s sustainability. Any rational analysis of Facebook as an ESG investment should consider the complicated relationships among these risks.
Adding to this confusion is the ever-expanding range of sustainable investing strategies that are thematic in nature, prioritizing specific sectors or ESG factors, such as funds and indices that focus on areas such as renewable energy, Catholic values or gender equality. The underlying investments in these different strategies can vary wildly, in both how the portfolios are tilted and what sectors may be excluded.
With all this new capital and fund formation, potential problems are cropping up more frequently. While sustainable funds generally have lower ESG risk than the broad fund universe and vote in favor of key ESG shareholder resolutions, Morningstar notes that support of such measures varies widely. That may be an understatement. The SEC recently issued a risk alert examining the policies and procedures of firms claiming to engage in ESG investing, observing instances of potentially misleading statements around portfolio management, proxy voting, and marketing and disclosure practices – in a word, greenwashing.
The European Union, always a few steps ahead of the United States and other countries in sustainable investing, recently implemented anti-greenwashing investment legislation requiring money management firms with over 500 employees to state whether they are reviewing the impact of their investments based on 18 different ESG metrics. If, as seems likely, U.S. regulators follow a similar path, funds and corporations will likely revisit disclosures and business practices. And the number of data providers aggregating new ESG data and disclosures will continue to swell, hopefully making the marketplace for sustainable investing more transparent.
In the interim, investors have their work cut out in separating the wheat from the chaff in ensuring that customized portfolios accurately represent the values and goals of their clients. Comprehensive wealth advisory and financial planning focused on a family’s long-term plan – philanthropic goals, next-generation education and investment priorities – should help drive the investment decisions across asset classes.
Impact investing, which doesn’t just tilt toward or exclude ESG factors, but instead attempts to make investments that will have a more proactive impact, can be typically achieved through illiquid investment structures, which we will be reviewing in the next issue of Independent Thinking. We believe this approach can support both clear ESG goals and attractive returns. It’s also important to note that portfolio managers acting on behalf of families and institutions with ESG goals need to have a firm understanding of the fundamentals of the underlying investments, across all strategies, whether passive or active.
Performance, long the shadow hanging over the heads of many sustainable funds, is no longer a sore point for investors. The average sustainable fund has outperformed peers broadly over the last one-, three- and five- year periods, with the majority of funds in the first or second quartiles for performance (see the chart below), thanks in large part to technology and sustainable energy gains. 2 We believe the secular trends propelling ESG investing are likely to continue and even accelerate, as regulators and both corporate boards and executives turn their attention more and more to ESG factors, notably in support of a transition to a greener economy.
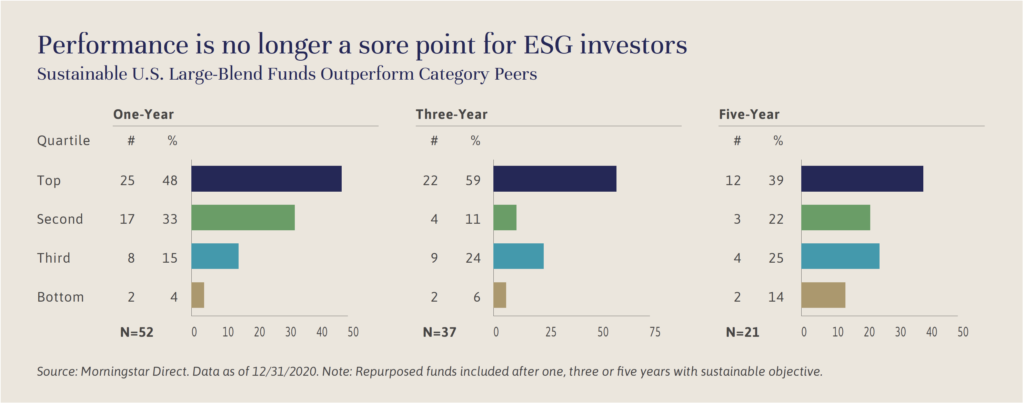
The result should be something of a virtuous circle, in which a company with a strong management team, a durable franchise, and good long-term growth prospects must be focused on long-term secular changes that impact their industry and all of their stakeholders. Companies that consider a long-term view as they make capital decisions and run their businesses day-to-day should be more likely to be more successful investments, from both a performance and a sustainability perspective. Customized portfolios of individual securities, mutual funds and illiquid investments can be designed around the values of individual families, foundations and endowments to deliver competitive returns to meet long-term ESG and financial goals.
Brian Pollak is a Partner and Portfolio Manager at Evercore Wealth Management. He can be contacted at brian.pollak@evercore.com.
Socially Responsible Investing (SRI) – The original definition of conscious investing, SRI tends to focus more on the passive avoidance of certain companies, most commonly referred to in relation to public companies. Portfolios can, for example, exclude companies with carbon-intensive operations or revenues derived significantly from tobacco, alcohol, gambling or handgun manufacture.
Environmental, Social and Governance (ESG) Investing – Investors utilizing ESG considerations in public markets act proactively, making both exclusionary and inclusionary decisions, and balancing the E, S and G considerations as they wish. For example, they can focus on environmental issues, avoiding carbon-intensive companies while investing in renewable energy. ESG factors are increasingly used as a lens in which to analyze potential private market investments.
Impact Investing – More commonly referenced in regard to private investments, these investments target measurable social or environmental outcomes to go along with a financial return. Asset classes for investment are wide ranging; project sizes can be big or small; and financial returns are varied. Affordable housing, microfinance, and resource scarcity are notable targets for impact investment, with tangible outcomes likely to measure low-cost units developed, a lowering of the “unbanked” population, and increased access to clean water.
Sustainable/Conscious/Responsible Investing – These terms encompass all modes of directing capital toward companies and projects in a thoughtful, conscious and repeatable way to deliver competitive returns while meeting an individual’s specific objectives.
Editor’s note: Evercore Wealth Management hosted an investment webinar on June 22 focusing on the prospects for – and potential impact of – rising inflation on portfolios, in addition to the firm’s current market outlook. Please contact your advisor for replay details.
Investors are right to fear rising inflation: It erodes real capital returns. But much of the market and media chatter around a resurgence of inflation after an almost 40-year lull misses a few key points that add up to one big point: The 2020s are nothing like the 1970s.
First and most important, productivity is accelerating. Productivity growth stalled in the 1970s due to low levels of innovation and the wave of Baby Boomers entering the workforce. Today, it’s growing at a rate of about 4% a year, as illustrated by the chart below, helping to neutralize the impact of rising wages and other input prices, and allowing companies to maintain or even cut prices.

Think of the time we are saving, as the pandemic forced consumers and companies to embrace digitalization more quickly than anyone could have expected.
Mobile banking, scanning and electronic signatures have relegated paper processes to the history tablets; doctors are communicating more efficiently with their patients and colleagues; and big business is exploiting big data to drive more efficient inventory management, product design and delivery.
Innovation propels further, faster innovation. New software code is written on top of previous code to achieve ever greater user-friendliness and new capabilities. System engineers are in turn continually increasing the productivity of software coders, which further compounds the productivity potential of the entire system.
Second, the U.S. dollar is reasonably stable, a far cry from the extreme volatility and 29% overall drop in the currency’s value in the 1970s, a decade marked by the abandonment of the gold standard, price controls, and the oil crises of 1973 and 1979. U.S. government deficits are high now, but so are those of most other developed countries, leaving the dollar reasonably secure as the global reserve currency. A stable dollar keeps the prices of imported goods from pressing the inflation rate higher.
Third, the demographic trends are now almost the opposite of the 1970s, as illustrated by the chart below. The average age of workers is increasing as skilled Baby Boomers delay retirement in anticipation of longer, healthier lives. Experienced workers are more productive and do not increase spending as quickly as younger workers forming households.
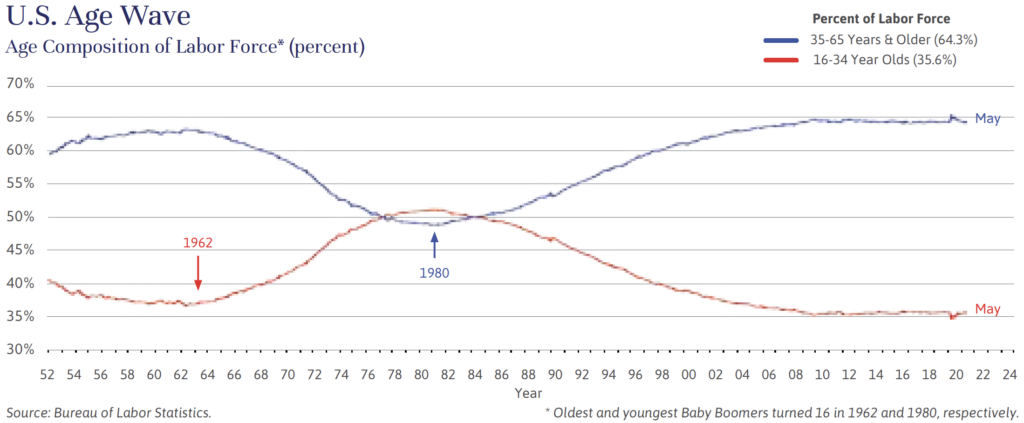
But what about all the current headlines on inflation, up 5% at the CPI’s last count? There is good reason to think that this current burst is a temporary consequence of the pandemic. Both wages and prices may prove more stable than they look at present. Any inflation number looks dramatic in comparison with the spring and summer of 2020 when the economy was at a near standstill. And supply disruptions caused by the rapid shutdown of businesses and management misjudgments about how rapidly the economy would improve will be ironed out over the rest of the year. For example, the current extreme shortages of lumber will be addressed as construction projects are delayed and sawmill capacity is increased. Finally, wage pressure exacerbated by unemployment benefits will ease when the benefits dry up in the next few months.
On balance, we expect inflation to return to a sub 3% growth rate by next year and productivity to continue growing at an annual clip of 4% or more. That will protect consumers’ purchasing power and support stock valuations. But we are mindful of the risks, notably that the Federal Reserve could keep interest rates low for too long and productivity could encounter some yet unforeseen challenges. We will continue to balance portfolios between investments that do well during periods of accelerating inflation, such as real estate and businesses that have hard assets and pricing power, and assets that benefit from a return to low and stable inflations, such as various fixed income instruments.
The 2020s are not the 1970s. But some things don’t change. Now is always the hardest time to invest, and thoughtful asset allocation to diversified portfolios remains the best way to protect and grow investment portfolios.
John Apruzzese is the Chief Investment Officer of Evercore Wealth Management. He can be contacted at apruzzese@evercore.com.
Blockchain is well named. At its core a specific type of database, a blockchain collects data together into groups, or “blocks,” which store digital information, such as financial transactions or asset ownership records. Imagine a series of these blocks. Each block has a specified storage capacity and, once full, is placed by a network computer next to the previously filled block by updating the openly viewable and editable record; it is only allowed to make this placement through network consensus. Now imagine those blocks linked together through cryptography, a computer-generated scrambling set to prevent alteration from outside parties. The result is an unbreakable (as far as we know) and irreversible list, or “chain,” crossing hitherto established silos and borders.
Bitcoin is the best-known application of blockchain technology: moving value online without the need for a trusted third party, such as a bank or payment network. But there is no end to other existing and potential applications. These include:
We are all just beginning to appreciate the scale of potential blockchain application. It clearly can disrupt significant technology platforms and traditional business models in ways similar to the revolutionary changes brought by the internet. As with any new disruptive technology, some efforts will fail and others will reap outsized rewards. We expect blockchain to be an area of increasing investor focus.
Editor’s Note: Evercore Wealth Management supplements its core investment capabilities with carefully selected outside funds across the range of the firm’s asset classes. Here we discuss opportunities in venture capital with Atul Rustgi, a Partner at Accolade Partners. Accolade is a venture capital and growth equity fund of funds, concentrating on the technology and health sectors. Please note that this represents the views of Accolade and not necessarily the views of Evercore Wealth Management.
Q: Venture capital investing is a long-term commitment, with investors sacrificing the liquidity of the public markets for the prospect of higher returns. What are the advantages of this approach to investing in the technology and healthcare sectors?
A: Given venture capital is a high-risk, long lock-up investment strategy, investors should be compensated with higher returns versus the public markets. We believe that software companies inherently have superior business models with high growth, high gross margins, high recurring revenue, low fixed costs, and the potential for significant profitability. As a result of these characteristics, public software companies are at all-time high valuations. What venture capital can provide is scale arbitrage, allowing investors exposure to these companies at both lower absolute valuations and lower multiples. Venture capital investors can benefit as these companies compound for 10-plus years in the private markets before entering the public markets at exponentially higher valuations.
Q: Your funds are focused on investing at the early stages and in growth rounds of financing. What do you think about valuation in the context of risk at these early stages?
A: Early- versus late-stage venture capital offer different risk returns. In early-stage venture, valuations are more compelling at sub $10-$50 million, where venture investors can achieve 10%-20% ownership of companies. Loss ratios for any early-stage fund can go as high as 60% of the portfolio, but if any one of these companies eventually achieves a multi-billion-dollar outcome, usually between five and 10 years from investment, they can return multiples of a manager’s fund. In late-stage venture capital, given that the product-market fit has been established, loss ratios are much lower but valuations are much higher.
Q: You have also been active in healthcare IT and biotech. What trends do you see there?
A: Biotech continues to be very exciting, with significant levels of innovation. Areas of focus for our managers include oncology and neurology. Diagnostics also continues to be an area of focus. Recent advancements are enabling the use of liquid biopsy in cancer screening, therapeutic selection and drug trial optimization.
Healthcare information technology is an emerging investment area. The 2009 Recovery Act was the catalyst for the adoption of electronic health records, or EHRs. About $30 billion in incentives were given to hospitals and providers to implement the use of EHRs and reporting of clinical quality measures, which in turn enabled the submission of claims electronically and has catapulted the volume of healthcare data. As a result, we have seen an explosion of new companies that aim to synthesize and analyze data to provide insights that lead to better outcomes, from value-based care to new care-delivery models.
Q: You’ve been investing in blockchain technology for several years, an area that has the potential to disrupt many industries. How do you think about the risks in investing here and what opportunities are you finding? Editor’s note: For a primer on blockchain, click here.
A: We have spent years researching and landscaping in blockchain technology. We have gained significant conviction in the space and have launched a dedicated fund of funds vehicle to invest in the leading blockchain managers.
Several years ago when we started performing due diligence on the blockchain space, there were a number of concerns that gave us pause. First, regulatory: Would the SEC shut it down? Second, there was not a deep bench of institutional managers. Third, the best engineers were focused on traditional tech. And fourth, there was not enough product market fit outside of Bitcoin, nor any commercial traction.
Today, all of those concerns have been alleviated. On the regulatory front, the SEC is not shutting it down, but instead creating guiderails. From a manager perspective, there are now over 100 firms with a VC approach, and 10-15 stand out as leaders in the space. Talent-wise, all the top universities have highly sought-after programs across cryptography and distributed systems, and we consistently hear that the best engineering talent is now focused on blockchain. Finally, we have seen real commercial traction and product-market fit both within and beyond Bitcoin.
In addition to hedge funds and companies buying Bitcoin, financial service companies such as Square, PayPal and Visa are incorporating digital assets into their offerings. Furthermore, we are seeing growth in areas beyond Bitcoin, such as decentralized finance (commonly called DeFi), consumer applications and emerging areas such as non-fungible tokens.
We believe the decentralized business model is as disruptive to centralized business models as online was to offline and SaaS to perpetual license software. Consequently, we believe blockchain has return potential similar to venture in the early 1990s.
For further information on Accolade and the other externally managed funds on the Evercore platform, please contact Evercore Wealth Management Partner and Portfolio Manager Stephanie Hackett at stephanie.hackett@evercore.com.
Inflation, said the late economist Milton Friedman, is taxation without legislation. In that context, it’s not surprising that the strikingly low consumer price inflation of the past 20 years continues to support outperformance in both stocks and bonds. But other forms of inflation are on the rise, threatening future returns.
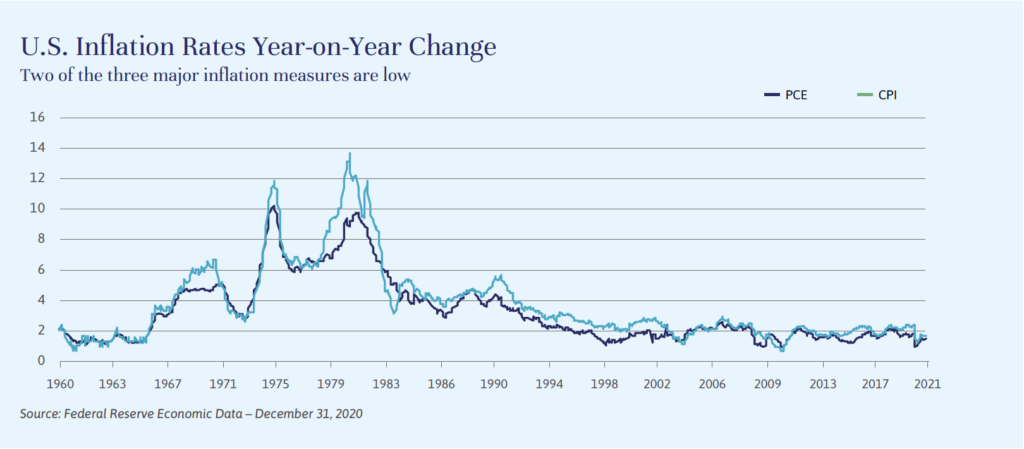
Let’s take a look at the three main types of inflation: consumer price, monetary and asset price. The interaction among them will be a significant driver in the markets and bears close watching.
Price inflation is the price of goods and services experienced by both consumers and producers. The primary metrics used to measure consumer inflation are the Consumer Price Index, or CPI, and the Personal Consumption Expenditure Index (PCE). Both measure a market basket of consumer goods and services, but use different formulas and basket constructions. Both are important, but the PCE is the measure on which the Federal Reserve focuses most of its attention. While the Fed has a stated inflation target of 2%, both indexes have largely fallen short of the market over the past 10 years and appear to remain in decline.
The secular forces holding back consumer price inflation have included high debt levels, technological change, aging demographics and increasing globalization, and collectively they remain a considerable force. But the rising tide of monetary inflation might change that equation.
Monetary inflation generally refers to increases in the supply of money, and is most commonly measured by the monetary base or “MB”, which includes currency in circulation and money held in the reserve accounts of Federal Reserve member banks. MB represents the liability side of the central bank’s balance sheet, while government debt (e.g., U.S. Treasuries) or other securities purchased by the central bank represent the asset side. As with any balance sheet, assets must match liabilities, so increases in central bank bond purchases simultaneously increase the monetary base. MB is tightly tied to “M2”, a broader definition and a calculation that includes cash, checking and savings deposits, money market securities and funds, as well as other easily convertible “near money” deposits. M2 is closely watched as an indicator of money supply and inflation. A rise in MB drives M2 higher, as illustrated in the chart below. The significant increases in both Treasury purchases by the Fed and Treasury issuance in 2020 by the government have led to a corresponding spike in M2 not seen in over half a century.

Recent events have undermined the conventional wisdom that there is a direct correlation between M2 growth and consumer price inflation. The Federal Reserve, along with all developed central banks, has increased the size of its balance sheets to historic levels.
This began post the financial crisis of 2008-2009, slowed briefly late in the last decade, and accelerated to historic records since the COVID-19 crisis began. Yet the inflation experienced by consumers has remained under the Fed’s target rate through this period of epic balance sheet expansion. Consumer inflation is even lower in Japan and the European Union, despite even more aggressive monetary policy actions.
It is clear that the money supply has leaked into the economy, but primarily in the form of asset price inflation. Monetary inflation impacts asset price inflation by creating excess liquidity and a lower discount rate, both of which allow for higher valuations. Fed treasury purchases push bond yields lower, encouraging savers to take on more equity and (lower quality) bond risk, to earn more return.
The central bank balance sheet (MB) expansion and M2 stock increase have inflated financial assets, most obviously stocks and bonds, but also real estate, gold, Bitcoin, and collectibles like fine art. Again, the conventional wisdom has been challenged, as we still have not seen evidence of consumer price inflation in the economy – but asset inflation, along with M2 growth, has moved higher faster and more fiercely than in 2009.
Household net worth, probably the best metric to understand broad-based asset inflation, hit a U.S. record in absolute terms in the third quarter of 2020 at $123.5 trillion, according to Federal Reserve data. Much of the value of U.S. household net worth derives from ownership of equities, bonds and real estate. On a relative basis to disposable income and to GDP, it is near the post-WWII high and at the post-WWII high, respectively.
It’s worth noting that asset inflation has primarily accrued to the wealthier part of society. Only slightly over half of U.S. households have a stake in the stock market, according to a Gallup poll conducted in 2020, but a separate Federal Reserve report shows that the wealthiest 10% own over 87% of the equities. Real estate is slightly more egalitarian, with 67% home ownership rates, but again, by dollar value, much of this is concentrated at the top. As wage inflation is a prerequisite for sustained consumer inflation, wage inflation that is equal to or especially in excess of consumer inflation would be one way to help alleviate this wealth disparity. It would mean less fiscal spending would be required for transfer payments, reducing the need for fiscal deficits and for aggressive monetary policies.

As discussed in the cover article of this issue, the potential for monetary and fiscal policy expansion to push consumer prices higher is far from a given. But it may be the single biggest risk to a traditional portfolio of stocks and bonds, as significantly higher consumer price inflation would likely take significant steam out of asset prices. While our base case remains a continued period of low inflation, we will continue to diligently monitor the factors that drive longer-term inflation and consider investments that could offer protection. As always, diversification of risk and appropriate asset allocation is our best defense against any long-term risk, inflation included.
Brian Pollak is a Partner and Portfolio Manager at Evercore Wealth Management. He can be contacted at brian.pollak@evercore.com.
Sky-high asset prices and record-low yields make for a dramatic investment landscape, a far cry from the one that global central bankers set out to shape years ago when they embarked on sweeping stimulus efforts, first to recover from the ravages of 2008-2009 and more recently to manage the economic fallout of the pandemic. Instead, the contrasts have become only more extreme, with stocks trading at 22.3 times forward earnings and all investment-grade fixed income securities, from 30-year Treasuries to investment-grade corporate bonds and municipals, now generating yields below the expected rate of inflation.

Other factors are at play, of course. But there is one main reason why the stock market, and for that matter, all asset classes, are so high and interest rates are so low – massive government deficit spending financed by central banks. The U.S. Federal Reserve, the European Central Bank and the Bank of Japan have pumped a combined $7 trillion of liquidity into the global financial system since mid-2020. While much of this deficit financing was necessary, it may have already gone too far. Indeed, contrary to perceived wisdom that stimulus is inflationary, the empirical evidence of recent years suggests that the more a country’s debt represents of its GDP, and the more that debt is assumed by its government, the lower the country’s prevailing inflation rate.
Japan’s government debt is now 238% of GDP, and the Bank of Japan, holding much of that debt, has assets of 126% of GDP; the compound annual inflation rate in Japan over the last ten years is 0.5%. The Eurozone has the next highest level of government debt financed by the central bank, with government debt at 97% of GDP and European Central Bank assets at 55% of GDP; the compound annual rate of inflation in the Eurozone over the last 10 years is 1.2%. Here in the United States, we appear to be heading down a similar path, with 99% of government debt to GDP and Federal Reserve assets at 34% of GDP. Our consumer price index rate of inflation is a relatively healthy 1.7%, healthier relative to those of Japan and Europe, but a far cry from the Fed’s stated goal of 2%.
In other words, all this monetary inflation has produced only asset inflation, not an increase in consumer inflation. Brian Pollak addresses this subject here.
Of course, an investor would receive a solidly positive real return over the next year or two in long-dated investment grade fixed income if long-term interest rates in the United States collapse to zero or go negative, as has happened in Europe and Japan. This seems to us possible but not likely: Federal Reserve officials have made it clear that they want to avoid negative nominal interest rates. If long-term interest rates do instead grind higher, the returns of long-dated fixed income in the short-term will be negative even before adjusting for inflation.
Up on the peaks of this investment landscape, the S&P 500 now sells for close to a record-high valuation at 22.3 times expected earnings over the next 12 months, or slightly more than in 2019 before the pandemic. Earnings are expected to grow an additional 15% in 2022, which would bring next year’s forward price-to earnings ratio down to a multiple of 19.5, but still well above the long-term average of 16 times. At the same time, some areas of the equity markets are experiencing levels of speculation – and related valuations – reminiscent of previous market peaks. However, as we’ve discussed a number of times in Independent Thinking, it seems to us reasonable for the market as a whole to sell considerably above long-term historical average valuation levels in this low inflation and interest rate environment.
Talk of another stimulus package in the United States – this time to the tune of $1.9 trillion, although that is likely to be watered down by the nearly balanced Senate – has given rise to more talk of inflation. Again, recent evidence suggests that the reverse will hold true and inflation will remain suppressed. But this dynamic could change if there is a reversal in one or more of the global deflationary forces, including population growth, innovation, high debt loads and globalization, or if the Fed simply throws all caution to the wind in its determination to increase consumer inflation by bypassing the banking system and sending newly created dollars directly to consumers.
Appreciable gains in inflation and interest rates could drag down stock market valuations closer to the historic average even if earnings continue to grow at an above-average rate for the next two years. The valuation levels on all financial asset classes, from fixed income to leveraged real estate, would come under pressure from rising inflation. We will be watching closely for the early warning signs of accelerating inflation, hoping to distinguish the real signals from the noise. Reports of a rise to about 3% year-on-year inflation in April and May should be understood in the context of the global shutdown last year; the early signs of sustainably higher inflation are likely to include rising oil prices, accelerating wages and significant deterioration in global trade.
We will also be watching for further evidence of improving productivity, as described below. Increased productivity growth could fully justify the high valuation of the stock market and allow for attractive returns in the future.
We remain confident in our asset allocation in current market conditions. We will continue to adjust individual portfolios to meet each client’s long-term goals and risk tolerance.
One trend could fully justify the high valuation of the stock market and generate attractive future returns: increasing productivity growth. Indeed, the rapid deployment of technological innovations into the economy might allow for the kind of rapid productivity growth last witnessed in the 1990s with the deployment of the personal computer.
Of course, we all knew that it was possible to do more with the technology at our disposal. But it took the urgency of the pandemic response for us to take advantage of it. This new openness and the associated potential productivity advances could very well accelerate economic growth and increase our standards of living fast enough to keep inflation under control and allow the economy to grow into the current high debt levels. We believe that the elevated valuation levels of the stock market would then be more than justified by the earning growth of the innovators.
At the same time, we are also close to an inflection point in energy when the cost of sustainable alternatives falls below that of fossil fuels. This will likely create attractive returns on large capital investments in electronic vehicles and in the solar and wind capacity to generate the power.
– JA
John Apruzzese is the Chief Investment Officer at Evercore Wealth Management. He can be contacted at apruzzese@evercore.com.
Editor’s note: Evercore Wealth Management supplements its core investment capabilities with carefully selected outside funds across the range of the firm’s asset classes, including illiquid assets such as private equity and real estate that have the potential for higher returns than the public markets. The following is extracted from the September 24 client webinar, Reappraising Real Estate: An Evercore Investment Roundtable, hosted by Evercore Wealth Management Partner and Portfolio Manager Stephanie Hackett.
The three guests, Garett Bjorkman (GB) of the CIM Group, Jon-Paul Momsen (JPM) of Harbert Management Company, and David Silvers (DS) of U.S. Realty Advisors, each run an external fund represented in many Evercore Wealth Management portfolios. CIM Group is well known as a lender, operator and developer of commercial real estate assets in urban areas, in particular areas undergoing revitalizations, including Qualified Opportunity Zones. Harbert’s U.S. real estate team focuses on value-add or opportunistic real estate investments across offices, apartments, mixed-use, and industrial properties in high growth cities. U.S. Realty Advisors is a triple net lease investor (meaning that the tenant commits to paying all the expenses of the property, including real estate taxes, building insurance and maintenance) and focuses on single tenant leases for office buildings and distribution facilities.
To view the full replay, please click here.
SH: We believe real estate has the potential to generate excess returns through both cash flow and capital appreciation, and also tends to be uncorrelated with equity markets. Each of your firms is actively investing in commercial office spaces, so let’s start there. We’ve all seen the pictures of empty office spaces and heard stories of people who are planning to work from home forever. But let’s separate out the hype from the headlines. What are the risks you are seeing?
JPM: Office today is one of the most intriguing spaces to be investing in because there is a lot of headline risk, and that risk comes with a kernel of truth. But that risk is being priced into the market, and there are opportunities to find great value with assets that are somewhat mitigated from the risk. The combination of a pull-back of equity, a pull-back of debt capital and very conservative underwriting makes for a material effect on value. If we can underwrite assuming all the downside risks, but buy assets according location and size – and find an insulated underlying tenant base conservatively, use less leverage, and underwrite them to higher return – the opportunity for outperformance is very strong.
GB: One of the interesting dynamics in urban areas that really differentiates this cycle from previous ones is that the underlying health of our tenants remains strong, in terms of collections. We’ve seen new leases in New York, San Francisco, Chicago and the other major metros basically dry up, and contracts that were signed pre-COVID in New York have been re-traded with discounts of about 15%. But everyone else is hanging on; there is a real desire to wait. For people who are forced to sell into a market of uncertainty over the next 18 months, those valuations should be low. That presents a lot of opportunity for buyers.
DS: In this kind of environment, single tenant net lease real estate (which is one tenant paying for a long term – never less than 10 years – at an agreed rent with all of the operating expenses) looks attractive on a risk-adjusted basis because the flows are predictable. Net leases tend to focus on mission-critical assets, such as a headquarters building and research and development facilities, which makes it difficult for companies to walk away. The advantage we have with net leases is that we have very long remaining terms. Oftentimes, in the panic of a six-month historical perspective as we have with the pandemic now, people tend to project infinitely into the future that the same results will occur. We know there will be more telecommuting and the need for fewer people in the office, but companies will also require greater social distancing in their facilities. We just have to be very careful in our underwriting.
SH: Let’s cast the net a little broader, across the real estate market. How does 2020 compare with other investment periods?
GB: The market shutdown across all sectors has really differentiated this period. The question now is how long can people hold on, as the carry costs in real estate are extremely high. How long can people continue to carry full-service hotels or luxury condos? Although I really believe in the long-term value, the short-term liquidity crisis has yet to play itself out. On the positive side, the nature of this pandemic means that the end, with a vaccine, will also allow us to rebound much more quickly than in any other downturn.
DS: There are always opportunities out there. The [key] is to be able to evaluate the particular asset in question. Now there are locational developments, such as central business areas, that are perceived as less desirable. But views do change. It’s a function of underwriting the credit and the real estate asset, stress-testing the deal, and asking how we are being compensated for the downside.
JPM: It is a good time to be very patient. There was an early sense that we all needed to work together to get through this exogenous shock, and everyone played nice. I think we are at an inflection point, as this is morphing from a short-term crisis to a real recession. Lenders are no longer playing nice; landlords are no longer playing nice; and the federal government from a fiscal stimulus point is no longer playing nice because they can’t play nice with each other. The only agency still playing nice is the Fed – but they can’t do it all. There will be more pressure placed on owners of real estate, and if you are not well positioned to work through that distress, you are going to be a forced seller. And then there will be opportunities. But most of that hasn’t worked its way through the real estate sector yet. It’s happened in hospitality, but not yet in offices and in multifamily where collections have been very strong. But that will come.
GB: I don’t think people have the patience any more. The banks aren’t going to be willing to provide additional relief. This is the beginning of what will be real distress throughout the marketplace, which presents a lot of opportunity – but it’s time to be very low levered, to have dry powder, and to be patient.
SH: The Fed has committed to keeping interest rates low, but the environment is very uncertain. What are you thinking about that?
JPM: We view this as a time to use less debt because of the uncertainty out there. But because of the distress, we can still find our returns using less leverage. I think that’s the right approach to take over the next 18 to 24 months while we work through this uncertainty.
DS: If something goes wrong, if your tenant blows up, would you rather have more equity invested in that deal or less? Higher leverage means less equity invested. We continue to follow this constraint: no more than 75% leverage, even with a very long-term lease. In fact, the leverage that we get from lenders is typically about two-thirds, and we think that is prudent.
GB: In this environment, we would rather take on incremental risks at the asset level to achieve greater return than take on assets with which you are relying on near-term performance to serve as debt cash flow on your leverage to meet your return objectives.
SH: Let’s hit another major asset class within real estate. Are distributions facilities and warehouses still attractive or are they getting overpriced?
DS: There is a great tendency of people wanting to own Amazon warehouses, just as there was demand for Walmart stores 30 years ago, and 40 years ago everybody wanted to buy Kmart stores. But the pricing for some of those properties out there, from our perspective, makes them unattractive investments, even when you can get terrific leverage. Have patience and wait it out.
SH: Is this a buyers’ market or a sellers’ market?
GB: We are, for the most part, waiting, but there are more buying opportunities that we foresee than selling opportunities. Lending in this market, given the dearth of capital, has been a very attractive place to play, and there will be a lot of opportunities to be buyers and to create solutions for people with liquidity issues.
JPM: We are always buying and selling. When we have a stabilized asset, we are sellers of that asset. Right now we are net sellers of multifamily, which we think is mispriced, and office, because long-term predictable cash flows are very financeable. By the same token, anything that is not long-term stabilized income today is on sale at a discount. But we are going to be patient buyers and conservative in how we underwrite.
DS: We are more transactional and opportunistic than most. Every week we look at our portfolio and ask if we want to sell or own each asset. There are certain places where there is crazy money out there and we are happy to sell, to let them have it. There are other opportunities where we want to buy and that’s where we want to be.
Stephanie Hackett is a Partner and Portfolio Manager at Evercore Wealth Management. She can be contacted at stephanie.hackett@evercore.com.
In the previous edition of Independent Thinking, we focused on the role of the large-cap growth stocks in supporting the remarkable market gains since the lows of March. Here’s another way to think about stocks now – in directional quadrants, two of which remain, in our view, best avoided in domestic equity portfolios.
The aspirational sector gets the most investor attention, and its member companies could be said to be having a good pandemic, benefiting from the rapidly accelerating shift to virtual communications and many investors’ assumptions that the long-term growth promise of these companies will eventually be matched with profits and earnings. (These same assumptions are also driving a surge in IPOs; 2020 is on target to be the biggest IPO year since 2000.) There are opportunities in this area but, in our opinion, the best are accessed at early stages through our carefully selected outside venture capital funds. In general, these companies are currently growing the top line with little to no visibility to bottom-line profitability. Indeed, the momentum-driven valuations on many of these stocks is well beyond the comfort level of most fundamental investors. While short-term gains have certainly been realized in many cases, there is little margin for error should growth rates slow or sentiment shift.
Though not quite as dramatic as those of many aspirational sector stocks, many fundamental growth leaders have also recorded big share price gains in 2020. This sector is home to Apple, Alphabet (the parent of Google), Amazon, Facebook and Microsoft, which together represent 25% of the S&P 500, and to a dozen or so smaller domestic growth stocks, including Adobe and Mastercard, also benefiting from accelerating trends. (Evercore Wealth Management includes the stocks named here except Facebook in our core priority list; every client portfolio is customized.) These are alpha, we-can-do anything-you-can-do companies, dominant in their end markets, in their cash flow generation, and in the strength of their balance sheets. And their top-line growth rates are matched by equally impressive bottom lines and consistently strong free cash flows. While valuations have certainly moved up across this quadrant, investors are hard-pressed to find this combination of growth and fundamentals elsewhere.
As our name for the third quadrant suggests, investors may want to avoid most permanently impaired companies. These include Main Street companies, focused on bricks & mortar retail and other deeply impacted sectors, which were already at a disadvantage and have only deteriorated since the arrival of COVID-19. With brick-and-mortar retail leading the way, 2020 may rival the Great Financial Crisis in terms of overall level of bankruptcies. As the uneven economic recovery continues, more companies will probably join them, including those that may currently appear attractive on a pure valuation metric. Investors should not be lured by tempting short-term valuations into adding long-term problems into portfolios. As with companies in the aspirational quadrant, we believe the best way to access opportunistic investments in this sector is through specialized managers, in this case distressed credit funds.
The final quadrant is one where investment opportunity appears most attractive. There are many long-term leaders that have yet to recover from the economic retrenchment of 2020. These companies vary widely, many facing near-term challenges, from high inventory levels after breweries closed due to pandemic restrictions in the case of Constellation Brands, to eventual park and movie theater reopenings in the case of Disney, to necessary technology upgrades by companies like CDW as the workforce returns to offices. As we hold shares of these companies in our discretionary portfolios, our view is that they have the capital structures, cash flows and management confidence to be able to survive this pandemic. In the interim, their stocks have yet to fully recover, providing what we believe to be some combination of prospective fundamental upside and margin of safety in the valuation.

At Evercore Wealth Management, we are focused at present on the long-term leaders quadrant when adding to existing positions and/or introducing new investments to core equity portfolios – and we remain confidently invested in the growth leaders quadrant as well. With very few exceptions, we are avoiding the other two quadrants, although again these categorizations are meant to be directional; there are no bright lines in our approach. Our goal is to build a portfolio of fundamentally strong companies at reasonable valuations. This balance has provided our investors with stability and strong performance through a very volatile period, giving us faith in our approach for the longer term.
Michael Kirkbride is a Managing Director and Portfolio Manager at Evercore Wealth Management. He can be contacted at michael.kirkbride@evercore.com.
Editor’s note: The following is extracted from an Evercore Wealth Management paper, Got Munis? The Case for Bonds as States Adjust Budgets and a recent client webinar, Rumors vs Realities in the Municipal Debt Market: How Bad is It?
All states have been affected by the shutdown of the U.S. economy in the spring and the subsequent slow – and erratic – reopening. And all rely on Washington, D.C. for adequate financial support, as they, not the federal government, are on the front lines in managing the pandemic. But the differences in fiscal health at the state level are extreme now, even more so than during the 2008-2009 fiscal crisis.
The ultimate effects on states of COVID-19 will vary based on their economic and revenue structures and poverty rates. States with low economic volatility and those willing and able to adjust tax rates are likely to suffer less severe impacts than those with less diversified economies or a high dependence on the most volatile taxes, such as very progressive personal income and capital gains taxes.
Other hurdles to recovery include the growing wealth gap, which places more pressure on states with large underserved populations, the long-term impact of remote working on municipal tax bases, the decline in oil prices on energy-dependent state economies, market volatility that will have an impact on instead of upon pension fund investments, and overall uncertainty about the duration of the economic crisis.
As a result, state and local governments are likely to operate with structural imbalances. For some, it could take years to recover and return to the revenue baseline. However, municipalities are resilient, meaning that they have many more levers to pull to ride out the rough patches than similarly rated corporations do. And with a historical default rate of just .008% of all investment grade municipalities, they have historically been considerably safer as well.
For these and other reasons, municipal bonds remain an integral part of many private investors’ diversified portfolios. They serve as a ballast to equity market volatility, as high-quality bonds most often move inversely to stocks. Most important, they can also provide a consistent and dependable tax-free income stream. While it’s hard to argue that yields are attractive from a historical perspective, municipal bonds are attractive when compared to Treasuries and corporate bonds on an after-tax basis, as illustrated in the chart below, and they remain the best risk-adjusted, fixed income vehicle for clients in the highest tax brackets.

It is important to consider the defensive asset nature of municipal bonds, even during the pandemic and the related – and unusual – stress felt by individual states. Even at these low rates, municipal bonds also offer total return potential beyond the current yield to maturity in the event that Federal Reserve policy moves interest rates negative on the short end or market expectations of longer-term deflation push market rates into negative territory. These are possibilities, albeit unlikely ones, and they would probably coincide with equity price volatility, furthering the case for bonds as a hedge for equities.
We are confident that we have the experience to navigate our clients through this challenging credit environment, and we expect all of our client holdings to pay timely interest and principal.
Jim Holihan is a Partner and Portfolio Manager at Evercore Wealth Management. He can be contacted at holihan@evercore.com.
Howard Cure is the firm’s Director of Municipal Bond Research. He can be contacted at cure@evercore.com.

For as long as most investors can remember, portfolio construction has started with a 60% allocation to equities and a 40% allocation to bonds, with adjustments then made for those looking for more capital appreciation or preservation. This classic balanced portfolio worked well, with each asset class partially offsetting the periodic downturns of the other to generate a combined annualized return of 10.0% (see chart) since the Barclays U.S. Aggregate benchmark index was established in 1976.

That was then. Now, investors need to reconsider the 60/40 portfolio. Apart from the extremes of the stock market, with some companies trading at heights difficult to justify and others at very justifiable lows (click here to view), the case for equities as the largest allocation in a balanced portfolio remains reasonable. But short-term bonds are not providing investors with adequate yield (or total return opportunities), and long-term investment-grade bonds can no longer provide much of a hedge against equity price volatility while their yields are pinned down to historically low levels by the Federal Reserve.
It seems to us that investors have to come to terms with the fact that bonds and other defensive assets (including cash) are likely to generate a negative real return (or a return that is less than the rate of inflation) over the next two to three years. This leaves us with three options. First, we can accept that hedging risk assets with an allocation to risk-free or defensive bonds now has a cost in real terms, not just an opportunity cost. Second, we can increase the allocation to growth assets and, with it, the overall portfolio risk. Or, third, we can increase the allocation to other asset classes, notably credit strategies, diversified market strategies and illiquid assets, while retaining some allocation to bonds.
For most investors, this third option is likely to prove the best bet. We believe there are still good reasons to invest in bonds (see chart below), albeit around the 20% or 25% level, for a balanced portfolio that we have been recommending for some time (now at the lower end of that range). But we believe that diversification beyond traditional stocks is as important as it ever was. To achieve it, we are focusing on three areas:
Growth diversifiers: This area of the portfolio is meant to complement the equity allocation by providing attractive, equity-like returns along with equity-like risks, albeit illiquid. Examples of these investments include private equity, venture capital and real estate, providing exposures difficult to attain in the public capital markets.
Pure diversifiers: Here we attempt to identify asset classes in which the return stream itself is uncorrelated to traditional markets and typically returns 3%-5% above the risk-free rate of return. Either passive or active investment vehicles, in either mutual fund or limited partnership/hedge fund structure, may be appropriate. Examples include the uncorrelated, such as catastrophic reinsurance risk; solar infrastructure development; dollar hedges, such as cryptocurrency investments or precious metals; and alpha-focused investments, such as market-neutral long/short hedge funds or option arbitrage strategies.
Income diversifiers: The main goal here is to find investments that provide higher yields than traditional high-quality bonds, but do not take on imprudent levels of risk. Liquid credit markets, such as corporate high-yield bonds and secured loans, high-yield municipal credit and securitized consumer and real estate credit, are candidates. In addition, private market investments with high levels of consistent income also present opportunity. These investments, such as triple net lease real estate and corporate or real estate direct lending, fit somewhere between traditional equities and bonds in terms of both risk and return, but provide important diversification if chosen prudently.
This larger allocation away from defensive assets does increase the overall portfolio risk and is generally less tax and fee efficient, but that difference in risk should be marginal if the individual investments are selected carefully and are well diversified, and if the total return is high enough to overcome the higher tax rate. The 60/40 portfolio has worked well for decades and could continue to do so in decades to come. But with the current yields on bonds below the rate of inflation, we believe that rethinking the allocation to high-quality fixed income in favor of other assets, for at least a portion of the portfolio, makes sense now.

John Apruzzese is the Chief Investment Officer at Evercore Wealth Management; he can be contacted at apruzzese@evercore.com.
Brian Pollak is a Partner and Portfolio Manager at Evercore Wealth Management; he can be contacted at brian.pollak@evercore.com.
How do we justify owning bonds as a core (approximately 20%) holding in our balanced portfolio in this environment?
In uncertain times, allocating a portion of the portfolio to securities that have certain cash flows – between semiannual coupon payments and known maturities – and a yield above that of cash supports overall portfolio construction. Active management is essential in this environment, to control for interest rate and inflation risk in portfolios by keeping duration risk relatively short, investing in high-coupon or callable bonds to speed up return income and shorten duration, and reinvesting principal and semiannual income from maturing bonds at higher rates.
While the hedge that bonds provide has diminished, longer duration bonds can still provide a hedge if interest rates turn negative – and this could happen if Fed policy moves interest rates negative on the short end or if market expectations of longer-term deflation push market rates to negative territory. While these scenarios at present don’t strike us as likely, they are possibilities.
The additional yield available to investors over and above the yield on Treasuries, while still below the rate of inflation, is attractive on a relative basis. Due to COVID-19 related credit concerns, municipal bonds yields currently yield 128% of the Treasury yield. This yield has averaged around 94% over the last 20 years. When additionally adjusting for top federal and state income tax rates, the yield that can be achieved in a high-quality municipal bond portfolio is more than double the yield available in Treasury securities in the intermediate to longer part of the curve. If income tax rates were to rise, the value of the tax exemption provided by municipal bonds would increase. This could compress the ratio between high-quality municipals and Treasuries, and is another reason municipals offer relative value today. For more on how a portfolio of municipal bonds fits into the overall asset allocations in this environment, click here.
Finally, the high liquidity and low volatility inherent in bonds provides investors with the framework to ride out drawdowns in the equity market with the knowledge that a portion of the portfolio is safe and liquid – and the confidence to stay invested in, or even add to, equities when prices are falling.
The United States is on course to amass a $3.7 trillion additional net debt for 2020, the equivalent of 17.9% of the national GDP, the largest on both accounts since WWII. The aggregate gross domestic government debt-to-GDP ratio has tripled since 2000. And the Federal Reserve is expanding its balance sheet at a record clip. But inflation, the natural consequence of fiscal and monetary easing, according to some schools of economics, is nowhere to be seen. Instead, deflation appears to be the bigger risk, at least for now.
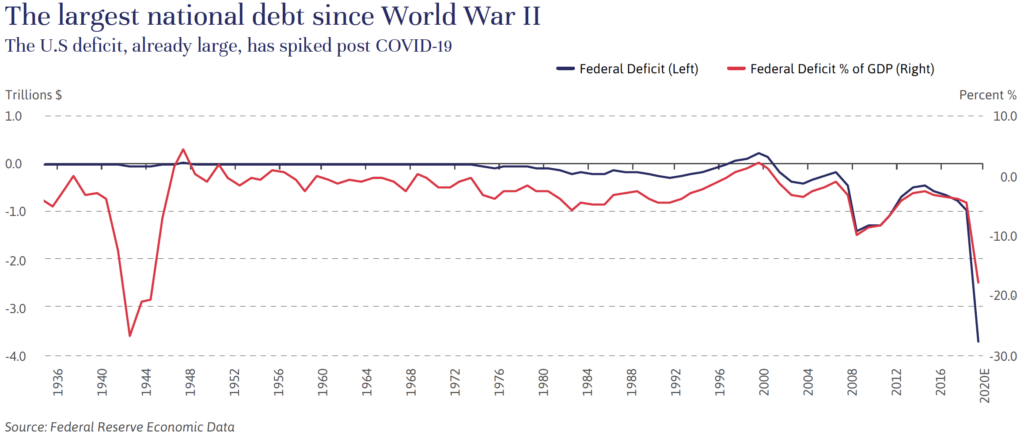
COVID-19 fiscal relief in the United States has to date focused on providing temporary support to the employees and employers most susceptible to layoffs and closures. It has also served to stabilize the markets. Much of that support is scheduled to roll off as the economy improves. Economists are in broad agreement that this fiscal spending will address already lost production but just partially offset the expected decline in GDP since mid-March. In other words, the relief so far has been just that; relief, not a lasting stimulus.
At the same time, consumer demand and prices have plunged. While there have been some supply shocks among essentials (milk, eggs and so on), the most recent CPI year-over-year reading was 0.2%. Clearly, the capital markets are not expecting much in the way of inflation anytime soon; the five-year, five-year forward breakeven inflation rate, which measures expected average inflation over a five-year period that begins five years from today, is now just around 1.5% – and 10-year inflation, as measured by yields on Treasury inflation-protected securities, or TIPs, is lower still, at around 1.3%.
Of course, this deficit spending by the federal government does add significant debt to the U.S. balance sheet. However, large fiscal deficits and government debt are generally not viewed by economists as inflationary. Instead, high debt loads relative to GDP often result in disinflation or deflation, as has already happened in Japan and much of Europe. Empirical studies show that the higher the sovereign debt load becomes, the more the returns on that spending diminish. In other words, at these levels each debt-funded dollar spent creates less than a dollar of growth, which is why high debt loads relative to GDP often result in disinflation or deflation.
Moving to monetary policy, the Fed expanded its balance sheet considerably post the 2008-2009 financial crisis, as did other central banks, without sparking inflation. But this year’s monetary expansion has been bigger and more rapid than previous efforts to jump-start the economy. Does it therefore follow that it will be inflationary?
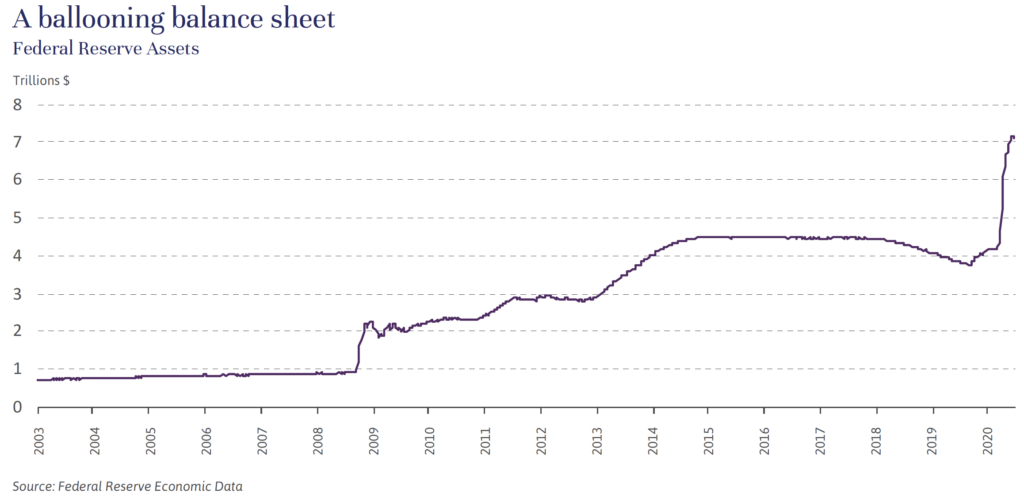
Perhaps it might be, if the Federal Reserve were to not just expand its balance sheet by purchasing securities temporarily – as it did with quantitative easing, or QE, post the financial crisis of 2008-2009 – but were to also extend credit to the private sector on a permanent basis, delivering this so-called helicopter money directly and permanently to the consumers and small businesses most likely to spend it. Importantly, this would involve the government and the Federal Reserve working in concert, with the Treasury issuing debts to finance the permanently elevated government deficit, and the Federal Reserve then purchasing the new debt with newly printed money.
This policy could be considered a version of the highly controversial Modern Monetary Theory, as described here, which would create the potential for high inflation. Indeed, some argue that a temporary version of this policy is in effect now, as the Fed will buy nearly all of the massive net debt issued by the Treasury in 2020. But there is not yet a broad expectation in the markets – or an explicit promise by the Fed – that this will be perpetual. That’s an important distinction, and it’s not yet evident.
We are also watching to see if other experimental monetary policies, such as negative interest rates or more permanently purchasing credit or equity assets on the central bank’s balance sheet, are deployed here in the United States – and if so, how those programs might impact inflation.
Another argument for rising inflation is the prospect of continuing deglobalization. If individual countries, concerned about the safety and controllability of their supply chains, look inward for goods production, a drop in global trade would be expected, making it more expensive for each country to produce goods, thus leading to some inflation. Sino-American relations, already problematic, could certainly deteriorate at the expense of international trade, as indeed was already the case pre-COVID-19. However, any cost or efficiency loss resulting from the altering of global supply chains would likely be temporary. We would expect that companies in the United States and other large developed markets would eventually adjust, aided by advances in technology such as 3-D printing and robotics.
In any case, these arguments for inflation remain largely speculative. As discussed in previous issues of Independent Thinking, three deflationary secular forces – high debt loads, aging demographics and technological disruption – continue to keep inflation in check. In fact, one could easily argue that all three have accelerated as a result of the current crisis. The potential for higher debt burdens on consumers, businesses and municipalities could create a cycle of private sector debt deleveraging, which in itself will be disinflationary. And the broad acceptance of and accelerated use of technology, such as teleconferencing and e-commerce, is also hastening disinflationary trends.
Low inflation was an important component of the decade-long bull market in equities and the key driver of the 30-plus year bull market in bonds. We do not view high inflation as an immediate, or even a likely, medium-term threat. Whether monetary and fiscal policies result in significant long-term inflation depends on the magnitude of deficit spending, the permanence of that spending, how much of that spending is monetized by the Fed, tax and regulatory policy, and other inflationary or deflationary forces occurring alongside those policies.
Brian Pollak is a Partner and Portfolio Manager at Evercore Wealth Management. He can be contacted at pollak@evercore.com.
The term deflation often has negative connotations, evoking images of a Depression-era economy. But deflation can be good or bad, depending on the drivers. At present, we see a mix of both.
Good deflation can occur as a result of improving aggregate supply from factors such as globalization and technological disruption. Resulting higher productivity and cheaper inputs shape an environment in which both consumers and producers can mutually thrive as prices, as well as costs, decline. Incomes rise and output increases. This type of deflation can coexist with real economic growth.
Bad deflation often occurs as a result of declining aggregate demand from trends such as aging demographics and high debt burdens. Declining consumption coupled with less investment produces a challenging cycle in which consumers further delay purchases and already high debt levels become even harder to pay back for companies. Unemployment rises and output detracts. This type of deflation pushes real growth lower, creating a downward spiral.
How is it possible that the stock market is so resilient? Approximately 20-30 million Americans are out of work, and both COVID-19 and social unrest continue, but the S&P 500 recovered from a historic shock within a month.
As remarkable as it may seem, we believe that the index is still reasonably priced. The aggregate valuation of the five most highly capitalized companies – Microsoft, Apple, Amazon, Alphabet (the parent of Google), and Facebook – is $5.6 trillion, or about 20% of the S&P 500. They are major beneficiaries of powerful and, with the COVID-19 response, now rapidly accelerating trends: internet and mobile device usage; online shopping; virtual communications; cloud computing; online advertising; and work-from-home technology. As a result, the expected growth rate of their combined revenues is 12% for this year and accelerating to 15% for 2021.
Four of the five tech giants are among the most profitable companies that have ever existed (Amazon, which is the only employee-intensive company, has a low profit margin in its core online retail business, so it effectively trades profits for growth). All have robust balance sheets with no net debt, and a combined cache of $464 billion in cash. They are continuing to fund future growth, spending a collective $116 billion in research and development in just the past year. That’s in addition to the billions of dollars spent on acquisitions that allow them to capture the latest innovations around the globe and, in some cases, eliminate competition. They also benefit from the network effect – gaining market power exponentially as they grow.
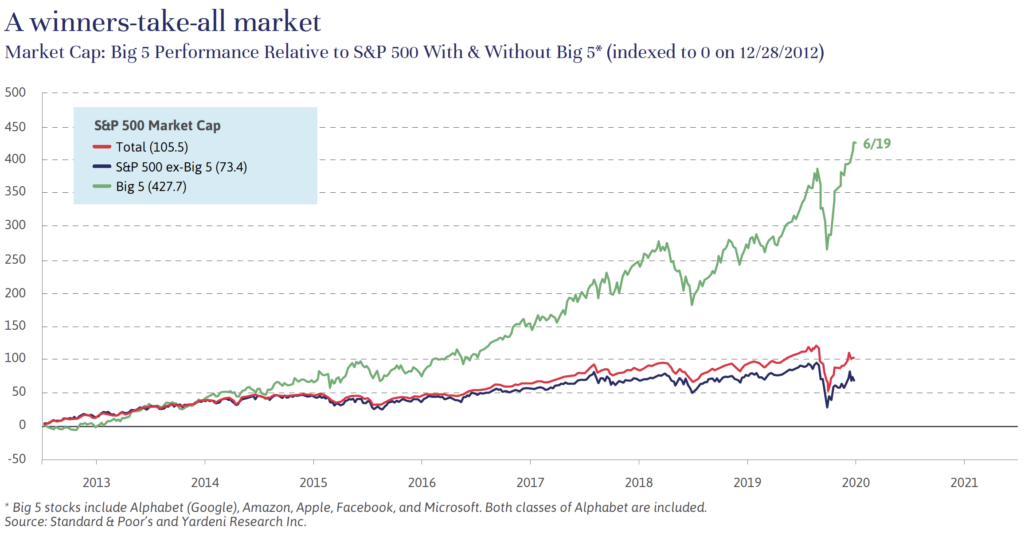
In short, the five are the winners in their respective winners-take-all markets. Take a look at the chart (above), which shows the rise of these companies relative to the broader S&P 500 index – and what the index would look like without them. Behind the big five are similar technology companies, including Netflix, that as a group make up another 10% of the S&P 500 index. The sector, together with the healthcare companies and other large companies that provide essential goods and services that have not been adversely affected by the COVID-19 crisis, represents about 50% of the S&P 500. (About 58% of Evercore Wealth Management core equity portfolio is made up of companies that currently have been either unaffected by the crisis or have benefited from the response.)
It’s another picture entirely for travel and entertainment, sports, sit-down restaurants, personal care/service and elective healthcare businesses. These companies employed over 30 million people in the United States before the pandemic, but the large public companies among them represent less than 10% of the S&P 500 by market capitalization. Those that are doing well can attribute at least part of that success to technology, such as the ability to receive online orders and serve customers stuck in their homes. In contrast, Alphabet, Apple, Facebook and Microsoft together employ just about 400,000 people; of the big five tech companies, only Amazon is a significant employer, with more than one million people.
It’s clear to us that the stock market weighted by market cap does not reflect the broad economy. Less clear is whether the technology giants are now too expensive. At 5.5 times aggregate revenues of $1 trillion this year, they certainly are not cheap. In the past year they collectively generated about $186 billion in free cash flow, of which $28 billion was paid out in dividends and $124 billion spent on stock buybacks. So the free cash flow yield is about 3.3%, and the yield on cash returned to shareholders from the dividends and stock buybacks is about 2.7%, with a reasonable probability that these numbers will grow at an annual rate in excess of 10% for the foreseeable future.
The five now have a higher valuation than before the crisis because their business fundamentals have actually improved as a result of the crisis, with accelerating revenue growth and steady or improving margins. The crisis has also resulted in significantly lower long-term interest rates – the yield on the 10-year Treasury has dropped from a range of 1.5%-2% before the crisis to 0.6%-0.9% now. Long-term inflation expectations have also fallen to well below 2%. Low inflation and low interest rates put a higher value on future cash flow, which pushes up equity valuations.
No company will be immune to the consequence of a long-term shutdown, of course. If current restrictions were to extend for multiple quarters or be reinstated, the resulting economic damage would begin to affect even the big five technology companies through, for example, reduced advertising revenue for Google and Facebook and fewer iPhone purchases. At present, however, the market is betting that the economy is going to reopen fast enough for most of the currently unemployed to get back to work before the more than $2 trillion of fiscal stimulus runs out. Certainly, that is the hope.
We continue to own Apple, Alphabet, Amazon and Microsoft, with our total portfolio weighting for the four companies about equal to the 20% weighting of all five stocks in the S&P 500 index, although the composition of individual portfolios varies. We do not own Facebook because we believe it has the most regulatory risk, and we are not comfortable with its governance structure.
There is still plenty of uncertainty in the markets, given the unprecedented nature of the response to the health crisis and the other issues roiling the country. Our core equity portfolio is part of our total asset allocation, which has been adjusted to reflect changes in the economy, and tailored within individual portfolios to meet each client’s long-term goals and risk tolerance.
John Apruzzese is the Chief Investment Officer of Evercore Wealth Management. He can be contacted at apruzzese@evercore.com.
The recent dramatic swings in the equity market are unprecedented in terms of speed and volatility. With economies and supply chains going all but dark in the wave that began in the Hubei province of China in January and is now hitting the United States, the impact to GDP and earnings will undoubtedly be quite severe, and is all but certain to be recessionary.
Among the hardest hit are energy/commodity companies, which are contending with a precipitous drop in the price of oil as Saudi Arabia and Russia lock horns just as global demand for oil falls off a cliff with the slowdown of the economy. Financial services companies and others with balance sheet concerns have also taken a beating. The Evercore Wealth Management core equity portfolio has almost no exposure to oil and commodities and very limited exposure to balance sheet financials.
Consumer stocks are also under considerable pressure, after years of outsized gains. As waves of quarantines bring spending to a halt, very high-quality retailers such as Home Depot have been punished severely, perhaps excessively. While under considerable pressure now, we expect the consumer to return to pre-crisis behavior. We will continue to assess this assumption, as it informs many of our holdings.
Information technology is a key component of the U.S. equity market. The biggest five companies by market capitalization – Microsoft, Alphabet, Amazon, Apple and Facebook – represent nearly 20% of the S&P 500 index and have been significant outperformers over the past few years. They have so far fared relatively well in this pandemic, thanks to differentiated business models and balance sheets that enable them to dominate their respective markets. Four of these five companies (excluding Facebook) remain core components of many of our portfolios.
We are not trying to pinpoint the bottom of this market. Even as indicators flash maximum fear and bearishness, we would seek some view to a plateau of the crisis and/or a settling of the extreme volatility before becoming more aggressive buyers of equities. But we are targeting high-quality investments that will be solid additions to the portfolio for years to come as they fall to prices that we believe reflect good entry points and reasonable valuations.
In markets such as these, there are advantages to having a long-term mandate. As painful as the day-to-day volatility is – and it is truly painful – patient capital is at a considerable advantage as it can take advantage of others’ need for liquidity at any price.
Tim Evnin is a Partner and Portfolio Manager at Evercore Wealth Management. He can be contacted at evnin@evercore.com.
Michael Kirkbride is a Managing Director and Portfolio Manager at the firm. He can be contacted at michael.kirkbride@evercore.com.
How is it possible for the stock market to swing 10% up or down in a single day, or for the entire Treasury bond yield curve to plunge by over 50% in under a month? Is it all about COVID-19, or is there more at play in the markets?
The recent level of market turbulence suggests that the most active investors are deploying a tremendous amount of leverage. Futures contracts that magnify positions by as much as twentyfold can disrupt traditional trading and leave investors reeling.
One very popular investment strategy may be especially to blame. When Federal Reserve Chairman Jerome Powell said last October that the Fed would not increase interest rates until inflation persisted above 2%, traders calculated that they could make large leveraged bets on a fall in short rates (from three months to two years). In other words, own the S&P 500 and enter into a futures contract with enough leverage to profit from, say, a 1% drop in interest rates to offset a 10% loss in the stock market.
The traders were further encouraged by evidence of the so-called Fed put; the Fed’s willingness to cut interest rates if the stock market declined. Their risk party play seemed like a sure thing; there was almost no chance that short rates would rise. By March 9, when the entire yield curve out to 10 years was no more than 0.5% and the stock market had dropped 20%, the trade had a 10% profit.
But at that point, there was no more room for rates to fall unless the Fed took interest rates into negative territory (still considered highly unlikely), so the interest rate hedge on the stock market became ineffective.
Up to $1 trillion may have been invested by hedge funds and large institutions in versions of this trade. Most of these trades have been unwound because these investors were only interested in owning the stock market when they thought they had a very good hedge. Once that was gone, they became sellers at any price.
Most of the risk parity trades have now been closed out and other highly leveraged positions have been liquidated. While the markets will still reflect intense investor reaction to the pandemic and its many associated economic headlines, we do expect a reduction in the current extreme volatility.

John Apruzzese is the Chief Investment Officer at Evercore Wealth Management. He can be contacted at apruzzese@evercore.com.
We do not believe that municipal bond credit risks justify the continued high yields relative to Treasuries. First, a brief recap. After 60 consecutive weeks of inflow into municipal bond funds averaging $2 billion a week, sentiment shifted at the end of February as the fallout from COVID-19 reached all asset classes. As investor sentiment changed, redemptions out of the municipal bond mutual funds rose to $12 billion from $250 million in three short weeks. Municipal bonds, like Treasuries, are defensive assets, meant to provide safety and stability to portfolios in periods of volatility in the equity market. But this forced selling, along with a related unwinding of leverage by municipal bond funds and speculative investors, temporarily restricted municipal bond liquidity and drove municipal bond prices lower, disrupting the usual relationships between the asset classes.*
The relationship is being restored. The benchmark Bloomberg Barclays Managed Money Short/Intermediate Total Return index has, as of March 26, recovered most of its losses, after falling by as much as 9.6% in 10 days from its peak on March 9, 2020. However, municipal bond yields remain extreme, at more than double the 100% buy indicator level, and even higher than levels reached during the financial crisis of 2008.
Generally, when the ratio between 10-year AAA rated municipal and Treasury yields rises above 100%, municipal bonds are considered attractive since they are tax exempt at the federal and usually state level, whereas Treasury bonds are taxable at the federal level and only tax exempt at the state level. As the chart below shows, the 100% ratio level has been a good buy indicator.

We expect that the ratio will revert back to its sub-100% historical norm over the near term as doomsday credit concerns prove to be unrealistic and demand returns to the market, since municipal bonds provide investors relative value to other fixed income products due to their tax-exemption and generally higher credit quality. In the interim, investors familiar with municipal bond credits, such as banks, insurance companies and wealth management firms, are beginning to aggressively buy municipal bonds, given their relative safety and attractiveness at current levels.
But what about the municipal credit implications of the coronavirus? The rapid spread of the coronavirus has led to extensive business closures, sudden high unemployment numbers, and unprecedented restrictions on social interactions. It will result in a significant decline in economic activity – likely a recession. But state and municipal governments, and their public enterprise systems, have dealt with economic recessions in the past and have, for the most part during prior recessionary periods, continued to provide needed services while repaying debt in full and on time.
For the municipal bond market, this is different from the financial crisis in 2008-2009 when the economy went into a recession; the auction rate market was eliminated; investment banks needed a federal bailout; and most monoline bond insurers were essentially rendered inoperable. Since the Great Recession, states and municipalities have made significant improvements to their operating budgets and liability profiles, refinanced their outstanding debt at lower rates, and improved funding of their operating reserves. So today, states and municipalities as a whole are financially stronger than at the inception of the Great Recession and will be facing the economic-related headwinds resulting from COVID-19 from this position of strength.
Municipal bond sectors cover the spectrum of state and local operations and are funded through a variety of taxes and fees, so the credit impact on different municipal bond sectors will depend on the severity and duration of the outbreak in a particular location. The source of funding for operations and, ultimately, the payment of debt service, is key to determining the vulnerability of each sector. Sectors that are generally less vulnerable to an immediate impact from a COVID-19 related economic slowdown include:
Sectors that will endure more extended interruptions in revenues will include the transportation-related, such as toll roads, airports and ports; higher education; and healthcare. These sectors derive revenues in enterprises whose operations have been severely curtailed or have their operations put under financial strain. However, our holdings in these sectors serve a highly valuable public service; generally have additional reserves such as cash and debt service reserve funds; and have ability to draw on lines of credits with banks to raise additional liquidity to weather an extended interruption.
Looking a little deeper into two of the aforementioned sectors – airports and toll roads – that we believe will most immediately be affected, we are comforted by the strength of the median borrower’s balance sheet. Debt issuers with greater liquidity – cash reserves and availability under long-term committed bank facilities – will be best positioned to independently weather the immediate economic fallout from the outbreak. According to Moody’s Investors Service, the median airport and toll road borrowers have enough cash reserves to operate nearly two years and over two-and-a-half years respectively without collecting any revenues.1
It’s important to stress that municipal bond issuers as a whole endure challenging economic conditions. Unlike other fixed income credit markets, defaults are extremely rare in the municipal market. Moody’s Investors Service reports that the average five-year U.S. municipal default rate from 2009 through 2018 has been just 0.16% and only 0.09% since 1970.
Furthermore, the economic distress – existing and still in the making – caused by the COVID-19 pandemic is inspiring bipartisan recognition at the federal level that the states are on the frontline in responding to the health crisis, and will experience revenue declines and spending increases. We are still working through the details of the $2 trillion Coronavirus Aid Relief and Economic Stabilization Act, or CARES Act. Early indications are that the plan will slow, but not eliminate, a fiscal imbalance in state budgets. We will be writing more about the CARES Act; at present it looks like a good first step in relieving the severe fiscal burdens faced by state and local governments but is likely to fall short of what is needed to both combat the virus and balance operating budgets. Its passage may make it easier to pass another relief stimulus or a spending package, if needed. The federal government is demonstrating a willingness to directly help the states’ and enterprise systems’ fiscal situation.
Our holdings were purchased subject to our stringent credit standards because they had adequate security and resources to make payments during disruptive periods. In this very fluid situation, we continue to vigilantly monitor our existing holdings and are taking advantage of the current opportunities to increase yield (i.e. income) in portfolios as appropriate.
Steven Chung is a Managing Director and Portfolio Manager at Evercore Wealth Management. He can be contacted at steven.chung@evercore.com.
Howard Cure is the firm’s Director of Municipal Bond Research. He can be contacted at cure@evercore.com.
As the United States shuts down in an unprecedented fight against a pandemic and more than three million people file for unemployment in a single week, Wall Street is making its bets on the economic outcome. The initial response was a 34% sell-off in the S&P 500 over a one-month period, and then a sharp rally on news of government rescue. But investors also need to see how quickly the federal government will be able to act; it won’t be easy to spend more than $2 trillion. The actual course of the virus and how quickly we return to something approaching normal behavior will be the most important factors impacting the markets.
No one really knows, of course. All we have to go on are examples in Asia, where the virus hit first and where economies are now beginning to reopen, and various epidemiological models. But the consensus of economists seems to be a plunge in second quarter GDP of between 10% and 25%, further but more modest declines of about 5% in the third quarter, and the beginning of a recovery in the fourth quarter. For 2020 as a whole, that’s a drop of between 5% and 10% in U.S. GDP, with a loss of upward of 10 million or more jobs. Earnings estimates are notoriously slow to adjust to such a sudden change in circumstances, but we have to assume earnings for the S&P 500 will be down by at least 20% or more.
The Federal Reserve is applying lessons learned from the financial crisis of 2008-2009 in acting as the lender of last resort to support the financial markets. In fact, the Fed is now going far beyond the actions it took during the last crisis in supporting a much broader list of securities, including corporate and municipal bonds. In addition, U.S. banks are in far better shape than they were going into that crisis. They have passed stress tests on their balance sheet that were comparable to the currently anticipated scope of this experience.
Additionally, Congress is attempting to inject $2 trillion into the economy. That represents about 10% of the country’s GDP. Just how quickly and effectively government can get these funds to households and businesses small and large remains to be seen. The timing is truly critical, as it will determine the number of jobs that could be saved and how many households should be able to bridge the gap to recovery.
In the interim, we as a society confront a terrible paradox. The more we shut down to flatten the curve, the more harm we inflict on our economy. The United States, like most of Europe and other developed economies, will be at near maximum shutdown to prevent an exponential spread of the COVID-19 virus while absorbing these expected hits to our GDP. We believe these current extreme measures aren’t economically sustainable. Difficult decisions will likely have to be made that balance health risks against permanent economic damage.
Most long-term investors are by nature optimists – and we count ourselves among them. Our democracy remains well balanced across the three branches of federal government, and the state and local governments. Information is rapidly disseminated and the potential for innovation almost certainly remains unlimited in our free market system. The entire world is now focused on the problem, which leads us to believe the outcome will be better than current consensus, developed under extreme uncertainty.
While it is not possible to predict the bottom of the market, it seems likely that this period will take the shape of a V; a rapid fall followed by a rapid recovery. So trying to time the exact bottom is not that relevant, as we likely won’t be there for long and will not be forced to sell.
The next few weeks will probably be extremely difficult for many people on many levels. We will all be concerned about our personal safety, the effects of unnatural isolation, and the fear of the unknown and the risks to the economy.
As the custodians of family and institutional wealth, our aim is to adjust client portfolios to ensure that they are sustainable through this downturn, with ample cash reserves, and are positioned to take advantage of opportunities as we start to see light at the end of the tunnel.
John Apruzzese is the Chief Investment Officer of Evercore Wealth Management. He can be contacted at apruzzese@evercore.com.
By Martha Pomerantz
A market timer and his money are often soon parted, especially in the face of recession and a bear market. Here are some of the capital allocation guidelines that we practice in all market environments:
We view this current sell-off as an opportunity to further enhance client portfolios, positioning them for strong, long-term expected returns. Investing in bear markets is challenging, both tactically and psychologically. But maintaining investment discipline goes a long way in protecting portfolios in tough times and preparing for better days.
Stocks have dropped precipitously as investors anticipate recession and an accompanying credit crisis.
The S&P 500 traded down 7% within a few minutes of opening on Monday, a decline dramatic enough to trip a circuit breaker and force a 15-minute trading halt. Volatility is always uncomfortable but it is important, especially in times like these, to distinguish between market panic and a reasonable response to risk.
A rapid drop in global economic activity over the next three months or so is to be expected given the cost of the efforts to reduce the spread of the Covid-19 coronavirus. The dramatic drop in the price of oil today – down 25% in the wake of Saudi Arabia’s decision to flood the market with oil – also raises the risk of a credit crunch in the energy sector.
But U.S. consumers went into this crisis in a strong position, bolstered by a buoyant jobs market and a robust savings rate. We also know that the drop in mortgage rates – down to record lows – should support further strengthening in the housing market. At the same time, the plunge in the price for oil and other commodities will exert further downward pressure on inflation and free up discretionary consumer spending.
We’ve taken a fresh look at every stock that we own in our core U.S. equity portfolio, to evaluate the potential impact of recent developments to earnings. We believe that on average the earnings of these companies should be able to weather a short-term downturn. We have limited exposure to energy stocks or traditional commercial banks in this portfolio that would be hurt by very low interest rates.
More broadly, we believe that the economy as a whole is strong enough to withstand a short-term shock to the system. If it takes longer than three months to bring the virus under control, our views could change. But the progress in China, where the rate of new cases seems to be slowing significantly, suggests to us that our prospects of success are reasonable.
That’s the good news. More worrying over the long-term is the continuing – and now dramatic – reduction in interest rates across the maturity spectrum. Unless there is a quick snap back, it appears that the United States could be mired in the extremely low and possibly negative interest rate environment that has plagued Europe and Japan. This makes it difficult for banks to make money and for investors to earn a real return on capital without taking on significant risk.
Distortions in the bond markets already reflect this changing dynamic. Municipal bonds currently represent better value than Treasuries, upending their traditional relationship. But even at these low yields, bonds remain negatively correlated to stocks, providing valuable diversification as well as modest but more predictable income. Portfolio allocations to credit strategies and illiquid investment opportunities, two of our other asset classes, help generate further cash flow.
Rock-bottom interest rates also suggest that the market is pricing in another 50 to 75 basis point cut by the Fed on top of the 50-point cut made last week. That would bring us to within spitting distance of zero, leaving the Fed with little choice other than to revisit quantitative easing. We hope it doesn’t come to that and would prefer to see some fiscal stimulus to get the economy humming again; not an easy option in an election year but one that both parties might support in the current environment.
The S&P 500 ended March 9, 2020 down about 19% from its historic high, selling for about 17x trailing earnings, or roughly its average valuation over the past 30 years. We are more inclined to buy stocks then sell at this juncture, rebalancing portfolios to their equity allocations. However, the uncertain nature of this coronavirus and the potential for continued market panic give us pause. We will act on opportunities as we gain further confidence in the future earnings of individual companies.
We’ve endured market volatility before and, as we have in the past, we are advising clients to remain calm. If portfolio allocations are kept intact, investors should be able to recover from market drawdowns and stay on track to meet long-term goals.

Investment and Wealth Management services are provided by Evercore Wealth Management, LLC an investment advisor registered with the U.S. Securities and Exchange Commission (the "SEC") under the Investment Advisers Act of 1940. Registration with the SEC does not imply a certain level of skill or training. Trust and custody services are provided by Evercore Trust Company, N.A. a national trust bank regulated by the Office of the Comptroller of the Currency.
Client retention rate is based on data from 06/30/24 – 06/30/25. Assets under management are as of 06/30/25